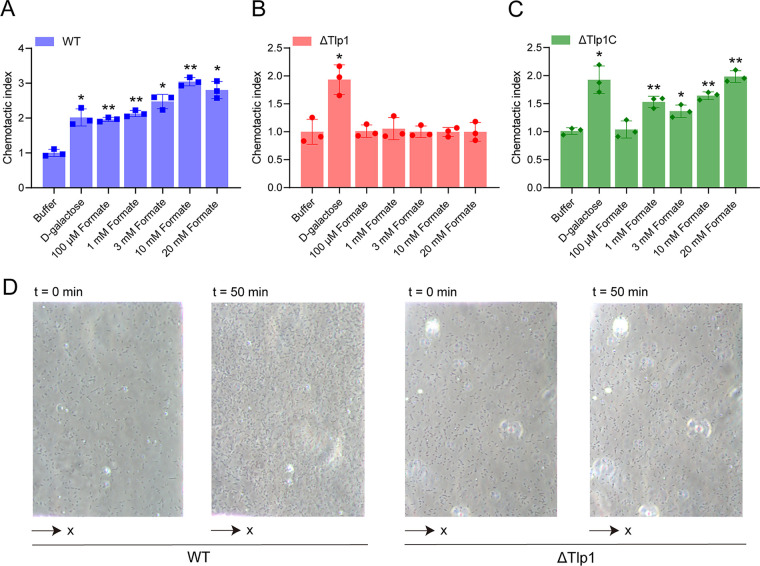
FIG 4.
Chemotactic responses of the C. jejuni strain NCTC 11168 toward formate, as measured using microfluidics. (A–C) The responses of C. jejuni WT (A), Tlp1 knockout strain ΔTlp1 (B), and Tlp1 complement strain ΔTlp1C (C) to different concentrations of formate. The data are shown as the relative chemotactic strength (chemotactic index) in the analysis region of the observation channel at 50 min after the addition of the indicated ligand concentrations at the source or without ligand (buffer). The chemotactic index was obtained by normalizing the corresponding cell numbers in the analysis regions to the number of cells in the buffer. The response to 20 mM d-galactose was considered to be the positive control. Error bars indicate the standard errors of three replicates. Significant differences, compared to the buffer, were calculated using a paired t test. *, P < 0.05; **, P < 0.01. (D) Examples of WT or ΔTlp1 cell distribution in the observation channel of the microfluidic device, acquired before the addition of ligands and at 50 min after the addition of 20 mM formate at the source pore. The x component (black arrow) indicates the direction up the concentration gradient of formate. The response is characterized by measurements of the cell numbers in the analysis region (150 × 100 μm) of the observation channel, which is the view in panel D. WT, wild type.

