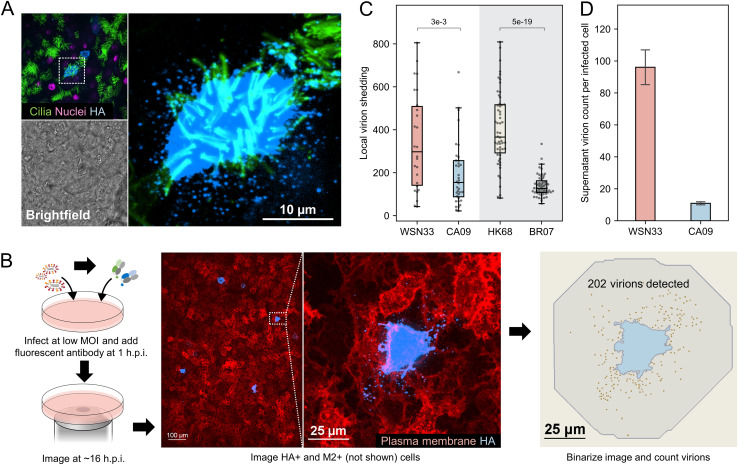
FIG 1.
Virions produced by infected cells are preferentially shed to the nearest neighbors. (A) Localized virion spread in differentiated human tracheal epithelial cells (HTECs) cultured at the air-liquid interface following infection through the apical compartment. Contrast is exaggerated in the magnified image to show released virions. (B) Schematic and representative images illustrating the approach for measuring local virion shedding. Contrast in the hemagglutinin (HA) channel is exaggerated so that the shed virions are visible. (C) Quantification of local virion shedding for four influenza A virus (IAV) strains. Individual data points represent virions from single sites of infection. The data are combined from three biological replicates (at least nine sites of infection/replicate). The P values are determined by independent t tests. (D) Quantification of virions detected in the supernatant (average particle count per HA-positive cell) for WSN33 and CA09. The data are combined from three biological replicates (i.e., separate cell cultures infected and quantified in parallel). The error bars represent standard deviation. The P values are determined by independent t tests. MOI, multiplicity of infection.

