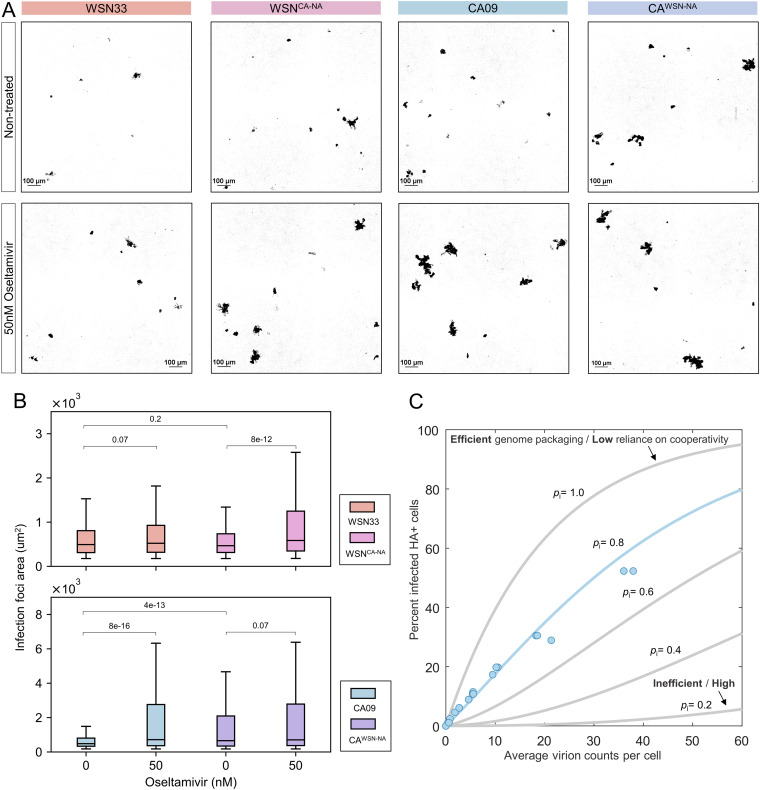
FIG 6.
NA activity modulates the local spread of infection. (A) Representative images of infected clusters of A549 cells at 48 h.p.i. Infected cells (shown in black) are visualized by an M2-specific Fab. (B) Quantification of the size distribution of infection foci at 48 h.p.i. The data are combined from three biological replicates containing a total of 500 to 1,000 foci for each strain. The P values were determined by Kolmogorov-Smirnov tests. (C) Relating the average virion count per cell to the probability of infection. The experimental data for CA09 are shown as blue circles. Theoretical curves from an infection model (see Materials and Methods section) are shown in gray, with the best fit shown in blue. The probability of segment delivery (pi) varies as indicated, while the fraction of noninfectious virions (ϕ) remains constant (0.05). See also Fig. S8.

