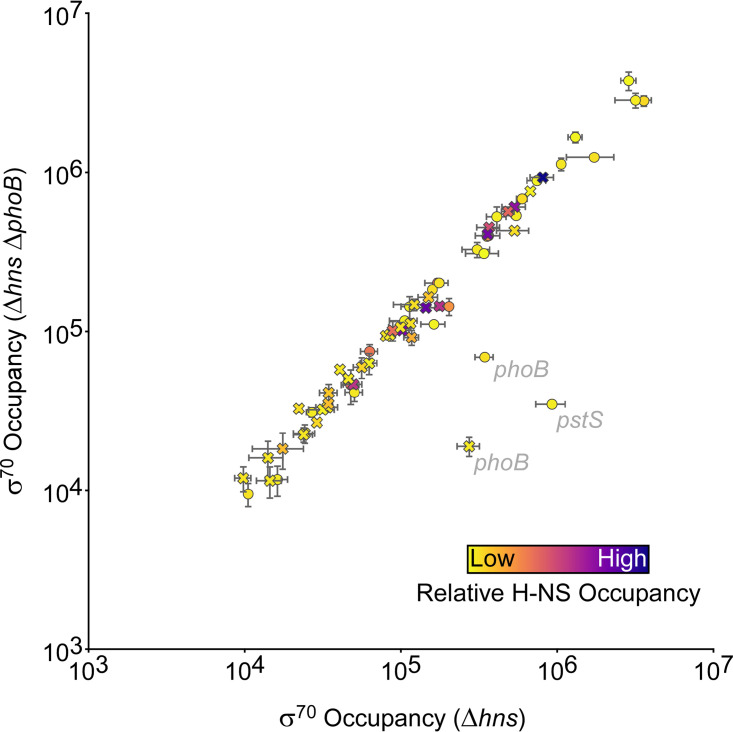
FIG 8.
H-NS does not suppress PhoB-dependent effects on recruitment of initiating RNA polymerase. The scatter plot shows normalized σ70 occupancy in wild-type MG1655 Δhns (AMD565a) and MG1655 Δhns ΔphoB (DMF85) for the 400-bp regions surrounding PhoB binding sites identified by ChIP-seq. Each data point represents a PhoB binding site. The color of each data point indicates the level of H-NS occupancy at the corresponding site (49). Intragenic PhoB sites are represented by crosses; intergenic PhoB sites are represented by circles. Genes associated with PhoB binding sites are indicated in cases where σ70 occupancy differs >2-fold between MG1655 Δhns (AMD565a) and MG1655 Δhns ΔphoB (DMF85) cells. Values are the average of two independent biological replicates; error bars represent ±1 standard deviation.

