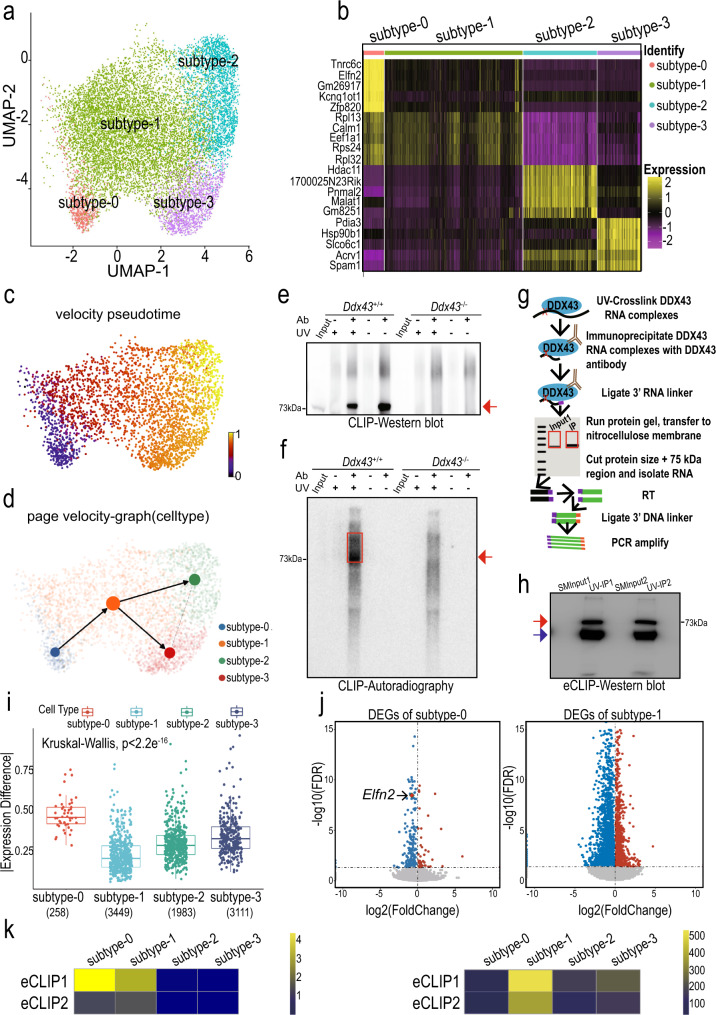
Fig. 5. Identification of four transcriptional states for STids with scRNA-seq and eCLIP-seq.
a Zoom-in analysis of STids reveals four cellular states (subtype-0 to subtype-3) during spermatid development. b Top 5 highly expressed genes for each subtype in STids. c Velocity pseudotime analysis on STids cells. Each cell is colored according to its velocity time. d PAGE directed graph of four states. e, f Western blot (e) and Autoradiography (f) analyses of DDX43-RNA complexes prepared by P32-radioactive conventional CLIP in P24 testes. Red arrow and red box indicate the DDX43 protein and DDX43-bound RNA signals, respectively. Both non-crosslinked and Ddx43–/– samples served as negative controls. These experiments were repeated three times with similar results. g Schematic of enhanced CLIP (eCLIP) protocol. See the Methods section for details. h Western blot validation of DDX43-RNA complexes prepared by eCLIP in P24 wild-type testes. SMInput1 and SMInput2 served as negative controls in two biological replicates, respectively. Red and blue arrows point to DDX43 protein and heavy chain, respectively. This experiment was repeated three times with similar results. i The boxplot for absolute expression difference value of DDX43 differential expression targets (DETs) in four cellular states. j Volcano plot showing gene differential expression (Ddx43+/+ versus Ddx43KI/KI) of subtype-0 and subtype-1. k The heatmap of DDX43 targets enrichments in down-regulated genes of two eCLIP-seq replicates. The heatmap is colored according to the -log10 (P value). We used one-sided Fisher-exact test to calculate statistical significance of enrichments (left panel). The heatmap of the number of DETs in two eCLIP-seq replicates (right panel).

