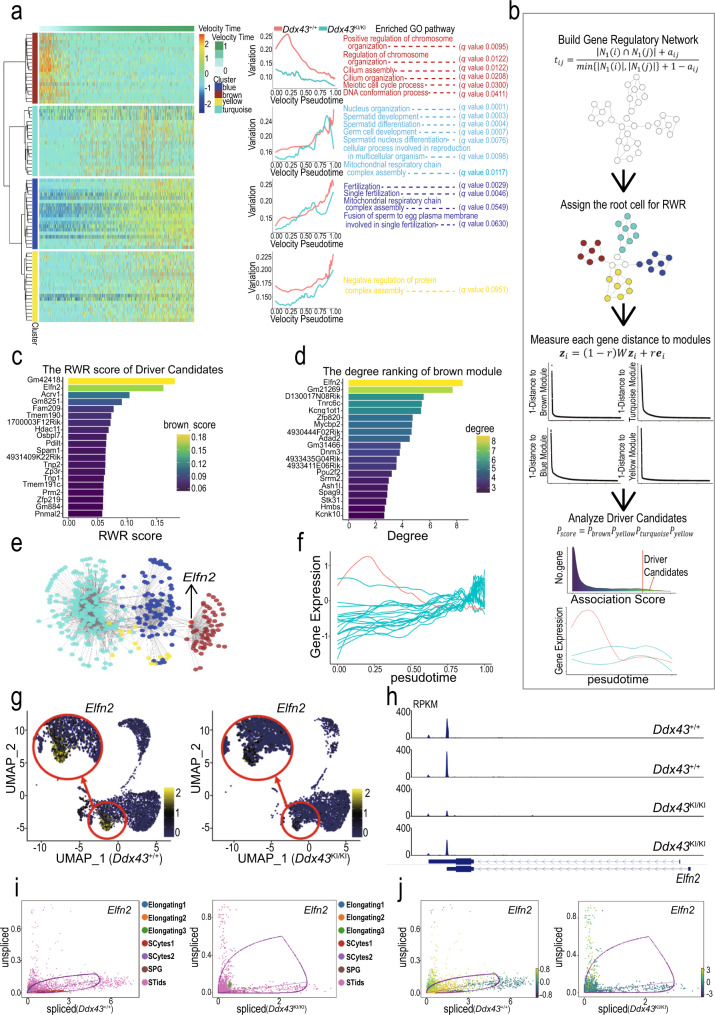
Fig. 6. Dynamic network analyses for identifying DDX43-regulated driver genes.
a WGCNA clustering of genes exhibiting down-regulated expression in subtype-0 and subtype-1. Each row represents a gene, and each column represents a single cell, with columns/cells placed in velocity pseudotime order and depicted by a thick colored line (top). Gene expression levels utilize a Z score transformation. b A workflow of page ranking algorithm to identify regulation driver candidates. In step 1, we converted the topological overlap matrix to Markov transition matrix through row normalization. In step 2, we assigned the diffusion root through regarding those cells belong to gene co-expression module as the seed cells. In step 3, we performed message passing and got four rank score, each measure the proximity of each gene to the module. In final step, we aggregated those scores and identified the overall highly ranked genes as the driver candidates. c Barplot of association rank of driver candidates to the brown module. Each bar is colored according to each gene topological associate score to brown module. The score is calculated from random walk with restart algorithm in (b). d Barplot of the network connectivity of driver candidates. Each bar is colored according to each gene connectivity in the network, which reflects the gene’s importance to the biological systems. e The gene regulatory network related to the dysregulation in subtype-0 and subtype-1. Each node represents a gene colored according to the module it belongs to. f Expression levels of driver candidate genes during spermatid development. The x-axis represents velocity pseudotime, and the y-axis represents gene expression levels. The expression curve of Elfn2 is marked in red. g Expression patterns of Elfn2 in Ddx43+/+ and Ddx43KI/KI spermatogenic cells, with their expression projected onto the UMAP plot. h The track plot of Elfn2 in Ddx43+/+ and Ddx43KI/KI subtype-0 cells, in two paired replicates. i, j The gene life cycle of Elfn2 in Ddx43+/+ and Ddx43KI/KI cells. Each dot represents a cell colored according to the cell types (i) or velocity values (j). The x-axis represents the spliced RNA expression level; the y-axis represents the unspliced RNA expression level.

