
Figure 2.
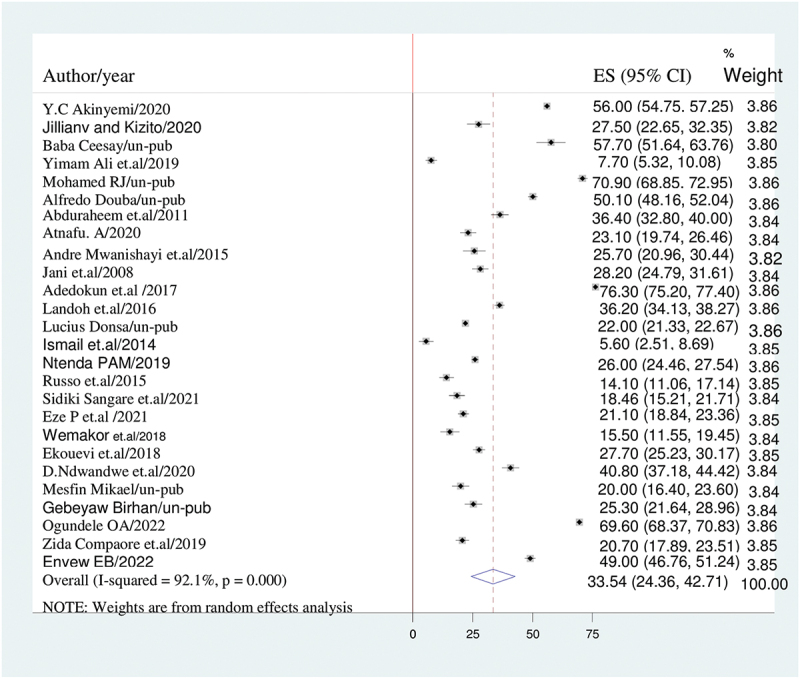
The forest plot of incomplete immunization with the diamond represents the summary point estimate (35.5%) and the horizontal extremity of the diamond is the confidence interval at 95% (24.4–42.7). the standard error is plotted at the y-axis and the effect size plotted at x-axis. The squares represent the effect estimate of the individual studies and the horizontal lines indicate the confidence interval; the dimension of the square reflects the weight of each study.