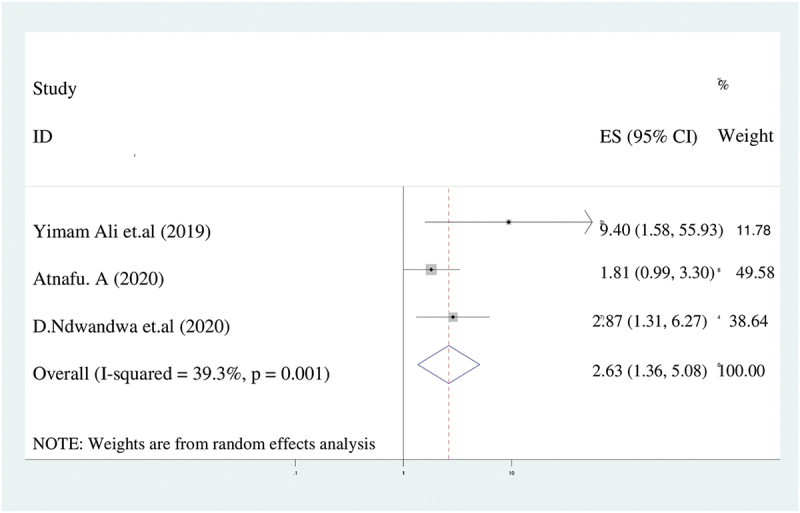
Figure 6.

The forest plot of pooled odds ratios showed the association between lack of antenatal care and incomplete immunization with the height of the diamond is the overall effect size (2.6) while the width is the confidence interval at 95% (1.4–5.1). The y-axis shows the standard error of each study while the x-axis the estimate of effect size of the each study. The vertical line denotes the no effect. The square represents the effect size of each study and the line across the square is confidence interval of each study.
