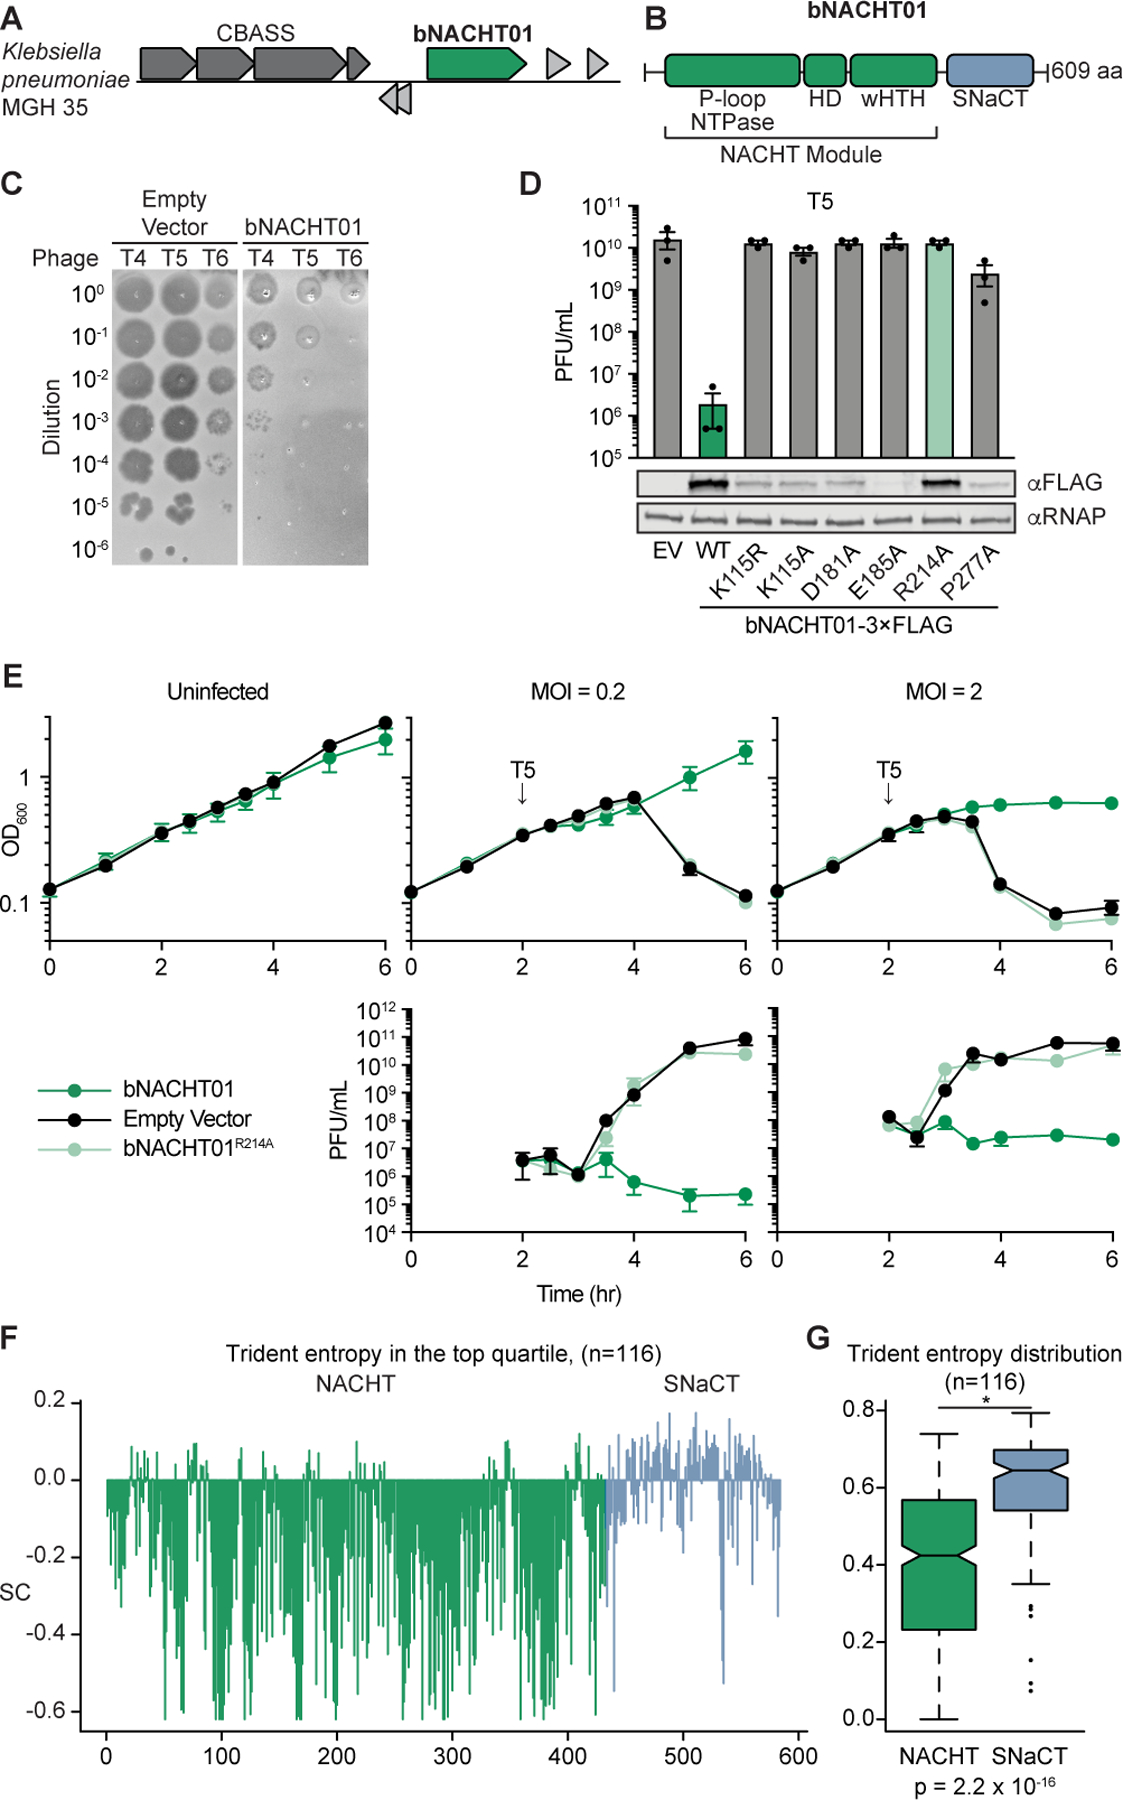
Figure 1. A bacterial NACHT domain-containing protein is antiphage.

(A) Genome context of bNACHT01, which is located near a CBASS system in Klebsiella pneumoniae MGH 35.
(B) Schematic of bNACHT01 (WP_015632533.1) protein domains, annotated by alignment to the NACHT module of NLRC4. The P-loop NTPase domain is also known as a nucleotide-binding domain (NBD), the helical domain (HD), and the winged helix-turn-helix (wHTH, also called WHD for winged helical domain) are indicated. See Figure S1 for a protein alignment of bNACHT01 with eukaryotic NACHT modules.
(C) Efficiency of plating of indicated phages infecting E. coli expressing bNACHT01 or an empty vector (EV). Data are representative images of n = 3 biological replicates.
(D) Above: Efficiency of plating of phage T5 infecting E. coli expressing the indicated genotype. Data represent the mean ± standard error of the mean (s.e.m.) of n = 3 biological replicates, shown as individual points. See Figure S1 for efficiency of plating of phage T4 and T6. Below: Western blot analysis of E. coli expressing empty vector or FLAG-tagged bNACHT01 of the indicated genotype. Representative image of n = 2 biological replicates.
(E) Above: Growth curve of E. coli expressing the indicated plasmid. Arrows indicate the time each culture was infected with phage T5 at the indicated multiplicity of infection (MOI). Below: Efficiency of plating of the phage present in each sample at the indicated time points. Data represent the mean ± s.e.m. of n = 3 biological replicates.
(F) Scaled Trident entropy (SC) values (see STAR Methods) for individual residues of bNACHT01-like proteins. The trident entropy for each column of the alignment, including both the NACHT module and SNACT domain, is scaled with respect to the top quartile. Positions with values greater than 0 are those with diversity in the top quartile.
(G) Distribution of trident entropy (S) values across NACHT and SNaCT modules in bNACHT01-like proteins showing significantly different mean Trident entropy. Values were compared using a two-sample t-test.
