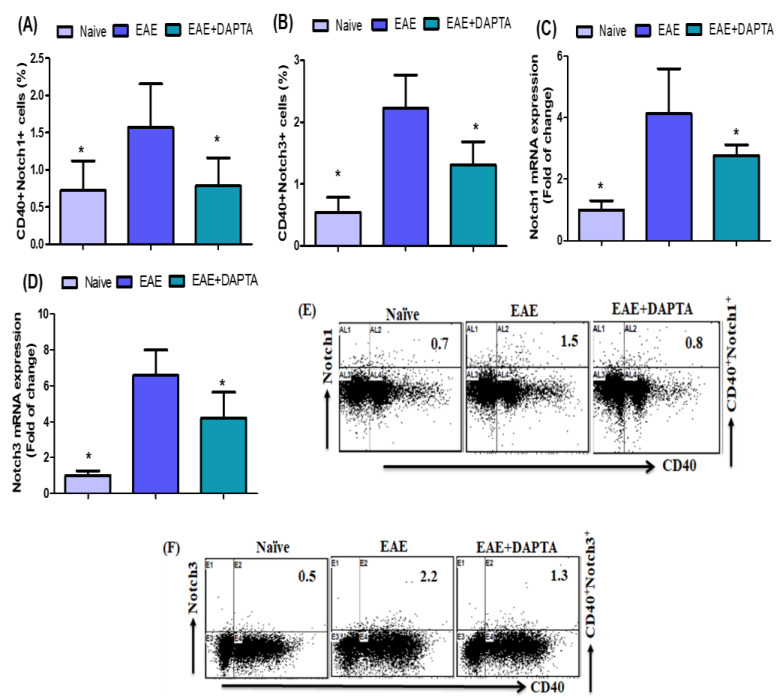
Figure 2.
(A,B) Effects of DAPTA on Notch1- and Notch3-expressing CD40+ B cells in the spleen cells were analyzed using flow cytometry. (C,D) Effects of DAPTA on Notch1 and Notch3 mRNA expression levels were analyzed using RT-PCR in brain tissue. (E,F) Flow cytometry representative dot plots of CD40+Notch1+ and CD40+ Notch3+ expressions are shown in one mouse from each group. Naive SJL/J mice were treated with saline (naive), EAE mice were treated with saline (EAE), and EAE mice were treated with DAPTA (EAE+DAPTA), at 0.01 mg/kg, i.p., once daily from day 14 to day 42. All data are shown as mean ± SD (n = 6). * p < 0.05.

