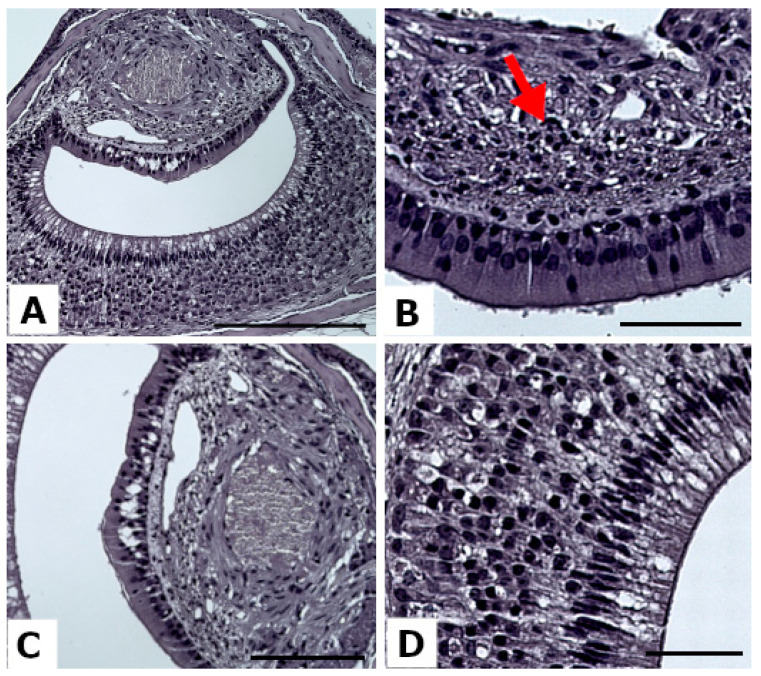
Figure 3.
Representative images of a score “2” in the tested parameters after hematoxylin and eosin staining. (A) Mouse VNO alterations, Scale bar = 200 µm. (B) Soft tissue alteration with a lymphocyte infiltration (red arrow). Scale bar = 50 µm; (C) NSE alteration, scale bar = 100 µm; (D) VNSE alteration, scale bar = 50 µm.

