Figure 1.
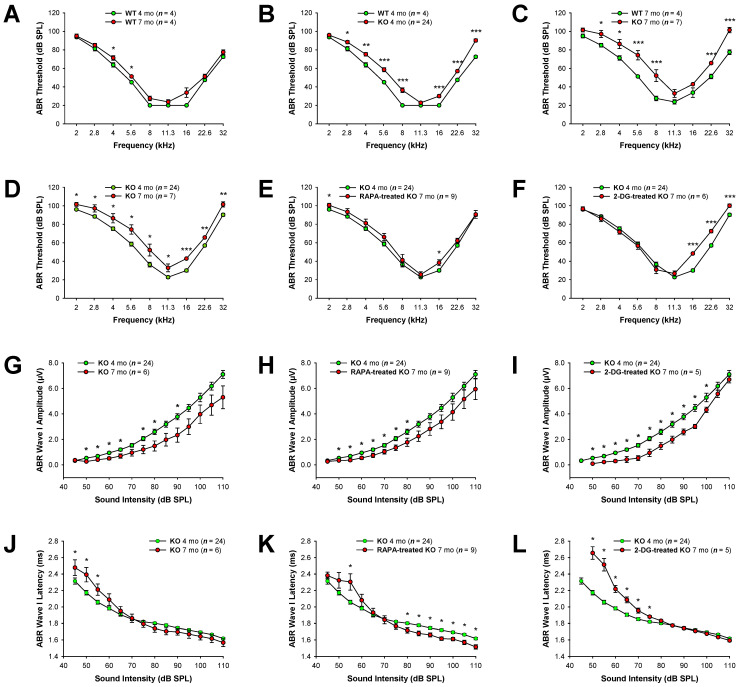
Auditory brainstem responses (ABRs) in rapamycin- and 2-DG-treated Fus1 KO mice. (A–F) Shown are graphs illustrating the average ABR threshold as a function of stimulus frequency in (A) WT mice at 4 and 7 months of age; (B) WT and KO mice at 4 months of age; (C) WT and KO mice at 7 months of age; (D) KO mice at 4 and 7 months of age; (E) untreated and rapamycin-treated KO mice; (F) untreated and 2-DG-treated KO mice. (G–I) Shown are I/O function graphs of the average amplitude of ABR wave I as a function of sound intensity at 16 kHz in (G) KO mice at 4 and 7 months of age; (H) untreated and rapamycin-treated KO mice; (I) untreated and 2-DG-treated KO mice. (J–L) Shown are I/O function graphs of the average latency of ABR wave I as a function of sound intensity at 16 kHz in (J) KO mice at 4 and 7 months of age; (K) untreated and rapamycin-treated KO mice; (L) untreated and 2-DG-treated KO mice. Data are presented as mean ± SEM. * = p < 0.05, ** = p < 0.01, *** = p < 0.001 (Student’s t-test).

