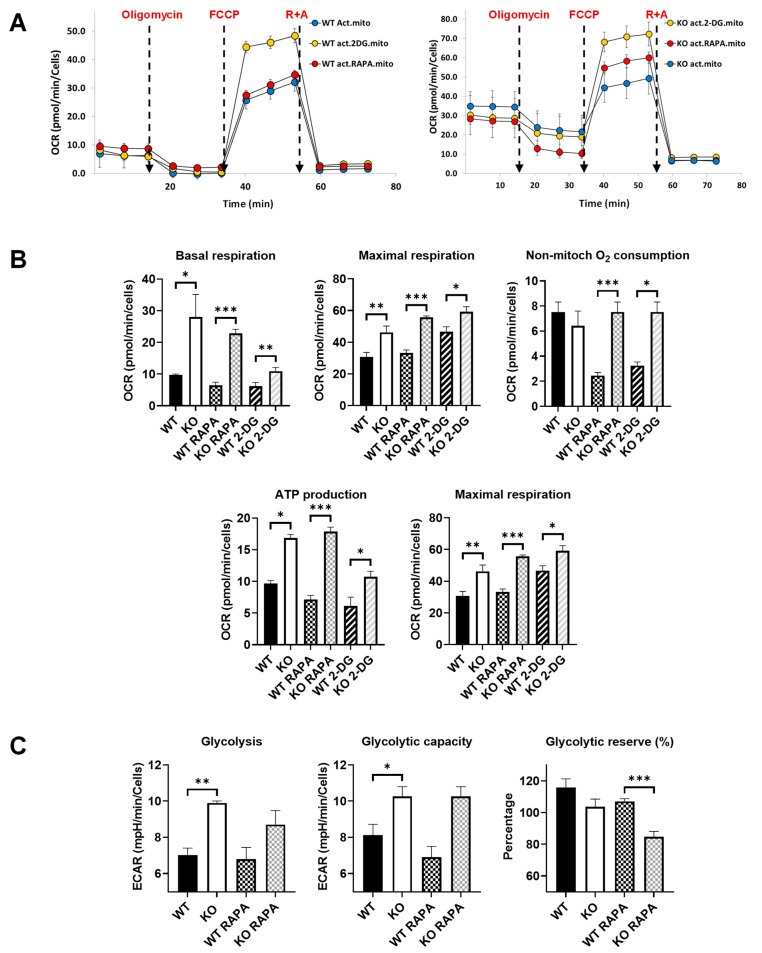
Figure 5.
Comparative energetic metabolism of LPS-activated Fus1 KO and WT bone-marrow-derived macrophages (BMDMs) in the absence or presence of RAPA and 2-DG. (A) Graphs showing representative Seahorse mitochondrial stress test graphs of WT and KO BMDMs treated or not treated with energy-modifying drugs. Oligomycin (1 µM), FCCP (1 µM), R + A (rotenone + antimycin) (0.5 µM each) were injected at the time shown with the dashed lines. (B,C) Bar graphs showing quantified protein-normalized mitochondrial parameters calculated based on oxygen consumption rates (OCR) interrogated using the mitochondrial stress test (B) and extracellular acidification rates (ECAR) obtained through the glycolysis test (C). Glucose dependence was assessed by sequentially injecting oligomycin (1 µM), glucose (10 mM), and 2-deoxyglucose (2-DG, 50 µM). Data (n = 4 separate wells per group) represent 3 experiments. Rapamycin and 2-DG were added along with LPS (100 ng/mL) 4 h prior to performing the tests. OCR and ECAR data were analyzed with Student’s t-test. * = p < 0.05, ** = p < 0.01, *** = p < 0.001. Data are presented as mean ± SEM.

