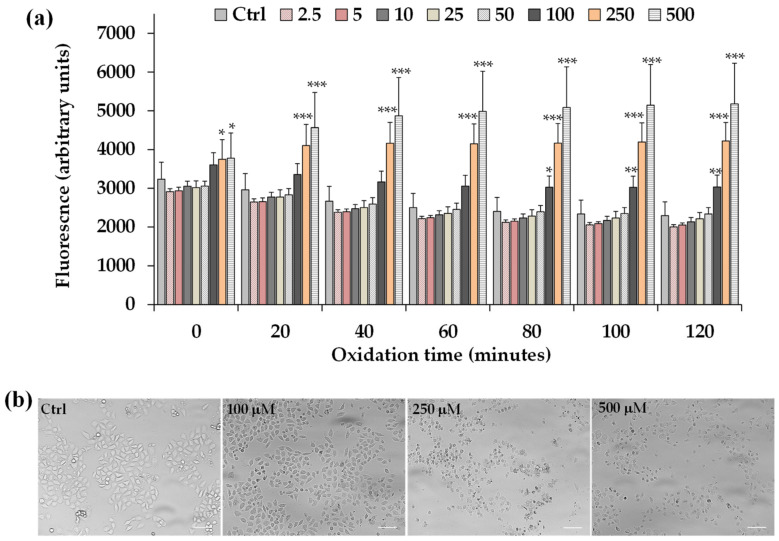
Figure 7.
(a) ROS-induced fluorescence (arbitrary units), by H2-DCF-DA assay, measured at 0, 20, 40, 60, 80, 100, and 120 min in HeLa control cells (Ctrl) and cells exposed for 2 h to different amounts of C. limon leaf essential oil (LLEO) (from 2.5 to 500 μg/mL). Data were presented as mean ± SD (n = 9); *** = p < 0.001, ** = p < 0.01, * = p < 0.05 versus the Ctrl at each time point. Evaluation of the statistical significance of differences between groups was performed by one-way ANOVA followed by the Bonferroni Multiple Comparisons Test. (b) The panel shows representative images of phase contrast of control HeLa cells and cells after 2 h incubation with LLEO at 100, 250, and 500 μg/mL. Bar = 100 μm.

