Figure 5.
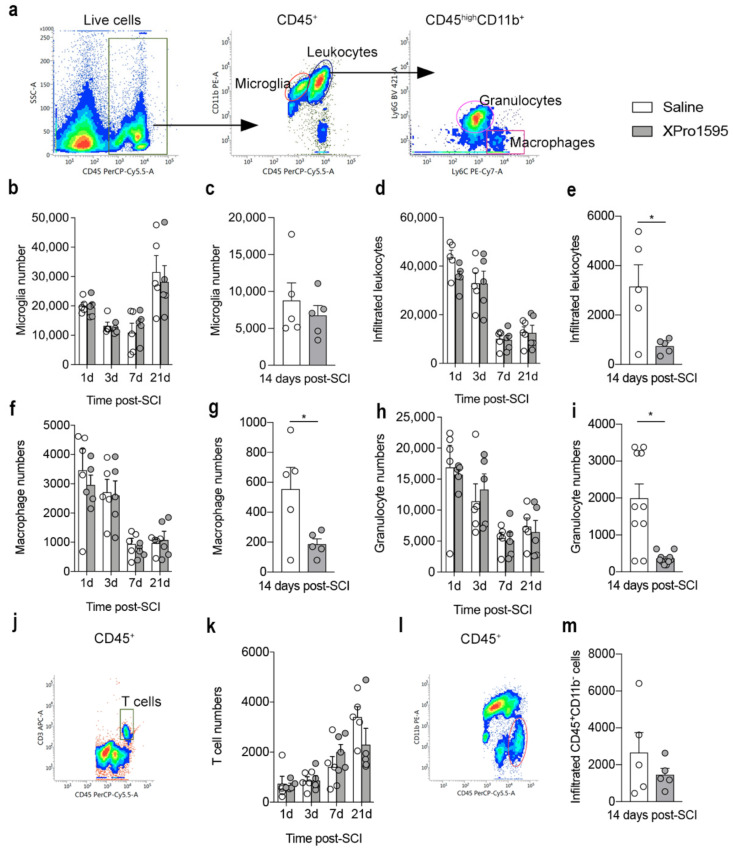
Inhibition of solTNF transiently decreases peripheral immune cell infiltration after SCI. (a) Dot blots showing the gating strategy for CD45dimCD11b+ microglia, CD45highCD11b+ leukocytes, CD45highCD11b+Ly6C+Ly6G− macrophages, and CD45highCD11b+Ly6C+Ly6G+ granulocytes. (b,c) Changes in microglial numbers 1, 3, 7, and 21 days ((b), Interaction: F3,32 = 0.29, p = 0.83, Time: F3,32 = 13.40, p < 0.0001, Treatment: F1,32 = 0.09, p = 0.77) and 14 days ((c), t8 = 0.74, p = 0.48) after SCI. (d,e) Changes in the number of infiltrating leukocytes 1, 3, 7, and 21 days ((d), Interaction: F3,32 = 0.76, p = 0.53, Time: F3,32 = 43.89, p < 0.0001, Treatment: F1,32 = 0.96, p = 0.33) and 14 days ((e), t8 = 0.16, p = 0.88) after SCI. (f,g) Changes in the number of macrophages 1, 3, 7, and 21 days ((f), Interaction: F3,32 = 0.21, p = 0.89, Time: F3,32 = 18.08, p < 0.0001, Treatment: F1,32 = 0.45, p = 0.51) and 14 days ((g), t8 = 2.46, p = 0.04) after SCI. (h,i) Changes in the number of granulocytes 1, 3, 7, and 21 days ((h), Interaction: F3,32 = 0.22, p = 0.88, Time: F3,32 = 11.51, p < 0.0001, Treatment: F1,32 = 0.01, p = 0.93) and 14 days ((i), t8 = 2.77, p = 0.02) after SCI. (j) Dot blot showing the gating strategy for CD3+ T cells. (k) Changes in the number of CD3+ T cells 1, 3, 7, and 21 days after SCI (Interaction: F3,32 = 1.97, p = 0.14, Time: F3,32 = 15.13, p < 0.0001, Treatment: F1,32 = 0.30, p = 0.59). (l) Dot plot showing the gating strategy for CD45highCD11b− lymphocytes. (m) Changes in the number of CD45highCD11b− lymphocytes 14 days after SCI (t8 = 1.05, p = 0.32). Data are presented as mean ± SEM with n = 5/treatment group/time point. * p < 0.05. CD, cluster of differentiation; SCI, spinal cord injury.

