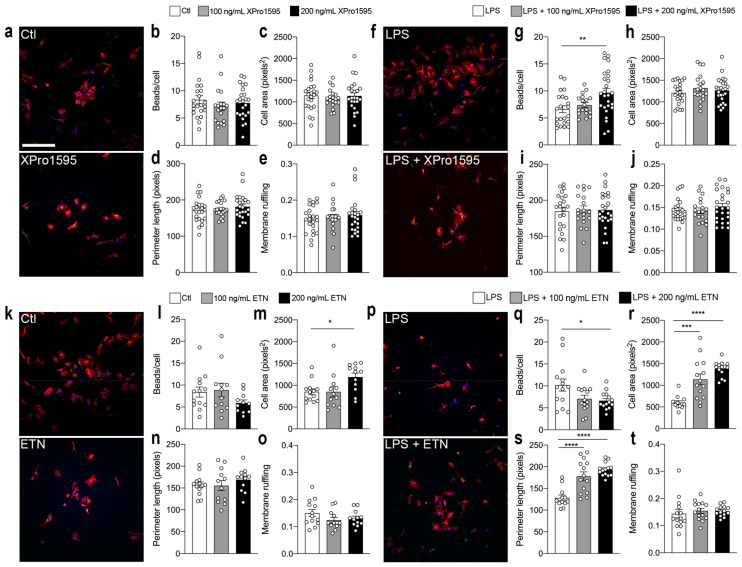
Figure 7.
Selective inhibition of solTNF increases microglial phagocytosis. (a) Untreated control (Ctl) and XPro1595-treated primary microglial cultures stained for Iba1 (red) and DAPI (blue) demonstrating phagocytosis of FluoSpheres Carboxylate-Modified Microspheres (FSCMs, green). (b) Engulfed numbers of beads/cell in Ctl microglia (n = 22) and in 100 ng/mL (n = 19) and 200 ng/mL (n = 24) XPro1595-treated microglia (p = 0.51). (c–e) Morphological features of microglia under control conditions and after XPro1595 treatment; cell area ((c), p = 0.79), perimeter length ((d), p = 0.48) and membrane ruffling ((e), p = 0.69). (f) Representative images demonstrating phagocytosis of FSCMs in lipopolysaccharide (LPS)- (100 ng/mL) and LPS + XPro1595-treated microglia. (g) Engulfed number of beads/cell in LPS-treated microglia (n = 22) and in LPS + 100 ng/mL (n = 18) and LPS + 200 ng/mL (n = 28) XPro1595-treated microglia (p = 0.004). (h,j) Morphological features of microglia after LPS stimulation with and without XPro1595 treatment; cell area ((h), p = 0.46), perimeter length ((i), p = 0.95), and membrane ruffling ((j), p = 0.48). (k) Representative images demonstrating phagocytosis of FSCMs in Ctl and etanercept (ETN)-treated microglia. (l) Engulfed number of beads/cell in Ctl microglia (n = 13) and in 100 ng/mL (n = 12) and 200 ng/mL (n = 11) ETN-treated microglia (p = 0.21). (m–o) Morphological features of microglia under Ctl conditions and after ETN treatment; cell area ((m), p = 0.03), perimeter length ((n), p = 0.49), and membrane ruffling ((o), p = 0.22). (p) Representative images demonstrating phagocytosis of FSCMs in LPS- and LPS + ETN-treated microglia. (q) Engulfed number of beads/cell in LPS-treated microglia (n = 14) and in LPS + 100 ng/mL (n = 14) and LPS + 200 ng/mL (n = 14) ETN-treated microglia (p = 0.03). (r–t) Morphological features of microglia after LPS stimulation with and without ETN treatment; cell area ((r), p = 0.0003), perimeter length ((s), p < 0.0001), and membrane ruffling ((t), p = 0.76). Scale bar = 80 μm. Data are presented as mean ± SEM, individual data represent the number (n) of coverslips/technical replicates from 3 independent experiments. * p < 0.05, ** p < 0.01, *** p < 0.001, **** p < 0.0001. Ctl, control; ETN, etanercept; LPS, lipopolysaccharide.

