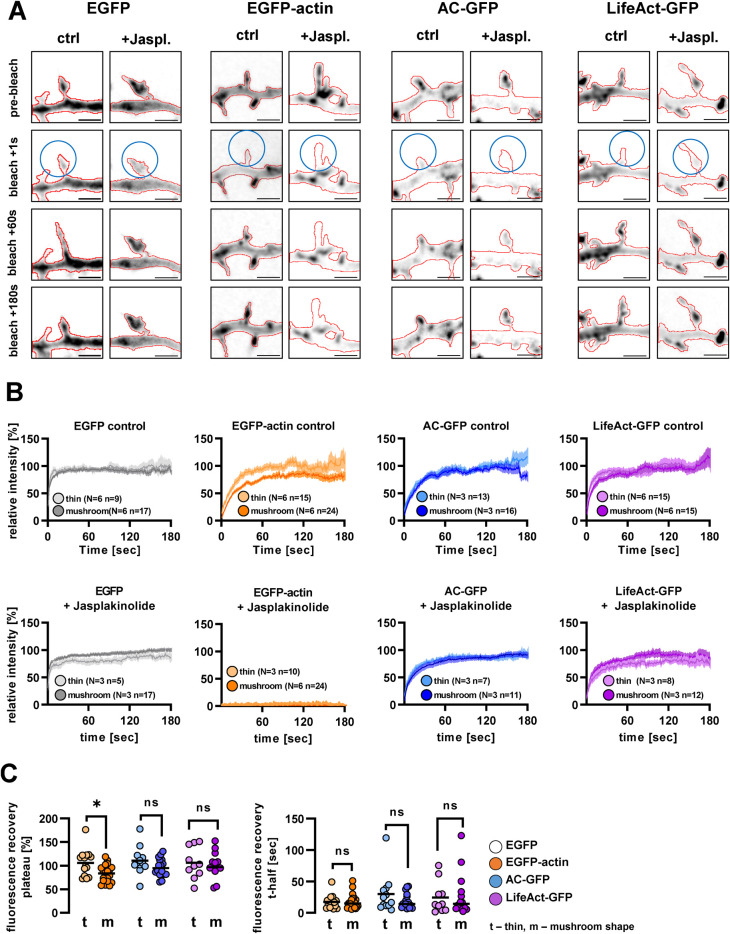
FIGURE 1:
GFP fluorescence recovery after bleaching in cells expressing different actin-labeling fusion proteins. (A) Representative live cell confocal image series of cells expressing EGFP, EGFP-actin, actin-chromobody-GFP or LifeAct-GFP. The GFP signal is shown in inverted grayscale; the outlines of the cell, based on mCherry, are highlighted by red lines. Blue circles show the bleached area. Jasplakinolide (5 µM) was applied for 7–10 min before imaging. Scale bar: 2 µm. (B) Fluorescence recovery curves after photobleaching in control (upper row) and 5 µM jasplakinolide-treated (lower row) cells. Fluorescence was measured in the mCherry positive area and normalized to the mean of the last 10 prebleach values in every spine. Thin and mushroom-shaped morphotypes were distinguished based on apparent spine morphology. (C) Fluorescence recovery plateau and t-half values of the analyzed control spines. Each point represents an individual spine. N, number of independent cultures; n, number of analyzed spines. Sample sizes and colors on panel C are identical to panel B. *, p < 0.05.

