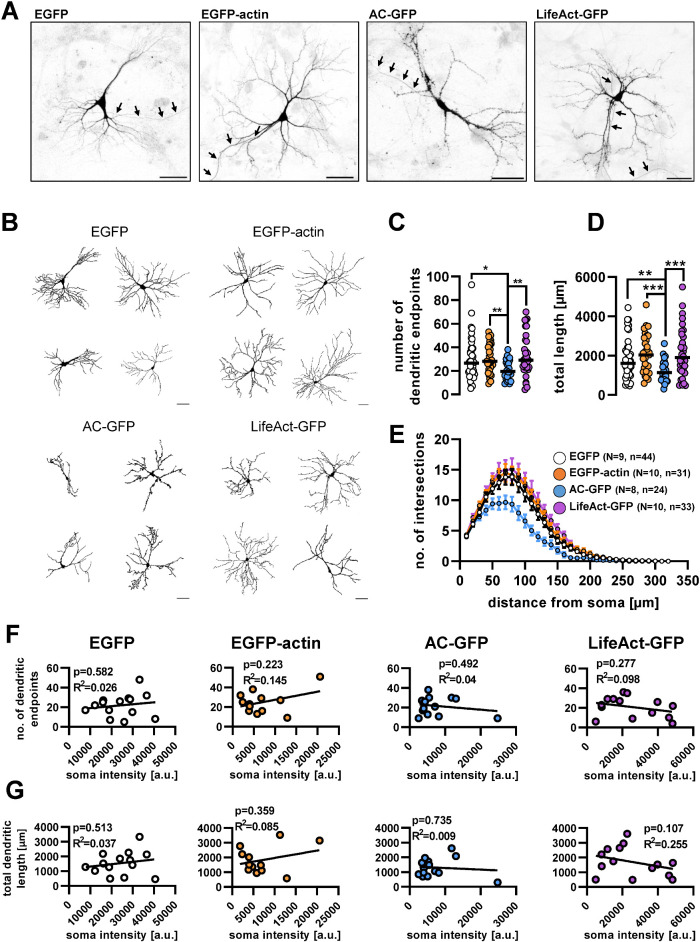
FIGURE 4:
Cellular distribution of actin-labeling fusion proteins and their effect on dendritic morphology. (A) Confocal images of cultured hippocampal neurons expressing actin-labeling fusion proteins. The images are shown as inverted GFP fluorescence. Arrows point at the axons. Scale bar: 50 µm. (B) Representative dendritic outlines used for morphometric analysis. Scale bar: 50 µm. (C) Number of dendritic endpoints and (D) total dendritic length of neurons expressing the different fusion proteins. Each data point presents an individual cell; black lines show median. (E) Number of dendritic intersections with increasing radius circles starting from the soma. Data presented as mean ± SEM. (F) Number of dendritic endpoints and (G) total dendritic length vs. GFP intensity in the soma. In F and G each circle represents an individual cell. Numbers of elements: N, independent cultures; n, individual cells. **, p < 0.01; ***, p < 0.001.

