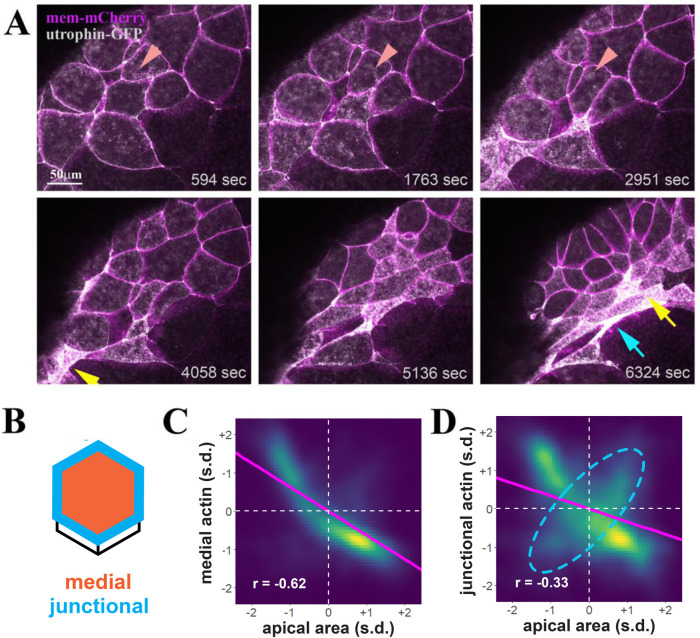
FIGURE 2:
Dynamic F-actin remodeling accompanies apical surface reduction during bottle cell formation. (A) Selected frames from a time-lapse movie demonstrate dynamic F-actin organization before an overt decrease in apical cell area (top panels). The dynamic F-actin signal in a single cell is marked by the arrowheads. As apical constriction commences, groups of cells constrict first and take round shape (yellow arrow), with neighboring, later-constricting cells assuming fusiform (blue arrow). The clusters of round cells can appear as one large cell as cell constriction and F-actin signal increase often obscure cell boundaries (e.g., the cluster indicated by the yellow arrow at the 6324 s frame consists of five constricted cells seen in the time-lapse movie). (B) Schematics of quantification of medial (orange) and junctional (blue) F-actin intensity within single cells. (C, D) Density plots of apical cell area vs. medial (C) and junctional (D) F-actin. Magenta line indicates linear model. s.d. = standard deviations. n = 11,748 observations of 132 cells from four embryos. (C) A negative correlation of medial F-actin intensity and apical area is uncovered, with the correlation coefficient r value of –0.62. (D) Junctional F-actin intensity is also negatively correlated with the apical area, though less so with the r value of –0.33. This weaker correlation may be in part due to a subpopulation of cells with a positive correlation between junctional F-actin and the apical area (dashed cyan ellipsis).

