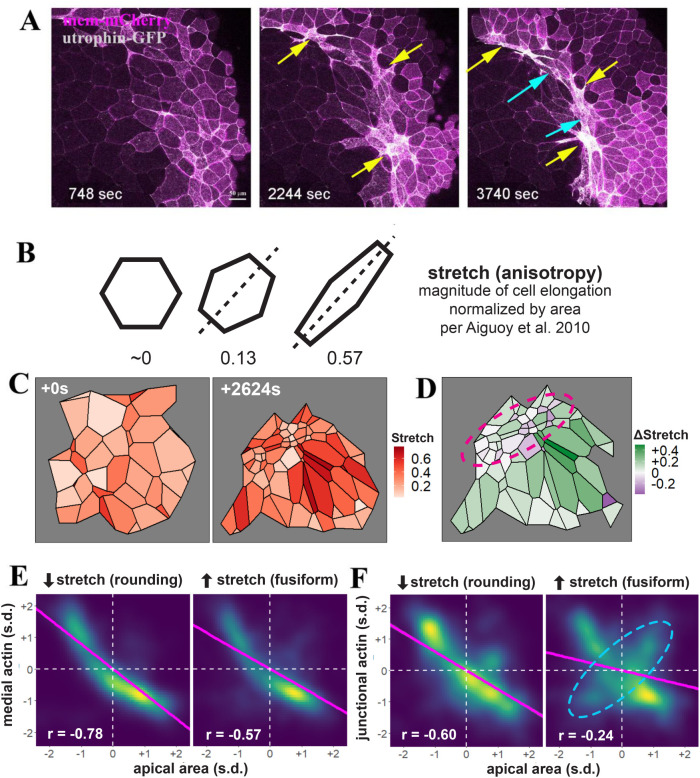
FIGURE 3:
Distinct cell shape changes accompany bottle cell formation. (A) Selected frames from a time-lapse movie reveal that apical constriction does not spread from a single point. Clusters of cells some distance apart can constrict around similar times. These cells tend to constrict early and form a round shape (yellow arrows), with the cells in between stretching in the circumferential direction to take the fusiform shape (blue arrows). The bottom yellow arrow in the 3740 s frame points to a constricted cluster of more than 10 cells. (B) Quantification of cell stretch by Tissue Analyzer, whereby the magnitude of cell elongation is normalized by cell area to generate a number ranging from 0 to 1, such that cells with the same shape but different areas will have the same stretch. (C) Example of heterogeneous cell constriction and stretch based on quantitative analysis of a time-lapse movie from the first and the last frames. (D) Mapping of changes of cell stretch onto the embryo images reveals that round, non-stretching cells are juxtaposed to the cells with increasing stretch in the blastopore lip (purple circle). The neighboring cells on the animal pole side of the blastopore lip also display distinct changes in stretch, with cells showing strong stretch preferentially abutting the round bottle cells. (E, F) Quantification of medial (E) or junctional (F) F-actin intensity reveals a stronger correlation with the round bottle cells than with the fusiform bottle cells. A subpopulation of fusiform cells with a positive correlation between junctional F-actin and apical area is labeled with a dashed cyan ellipsis. Magenta line indicates linear model. s.d. = standard deviations. n = 3171 observations for cells decreasing stretch (rounding) and 8709 observations for cells increasing stretch (fusiform) collected from four control embryos.

