Figure 1.

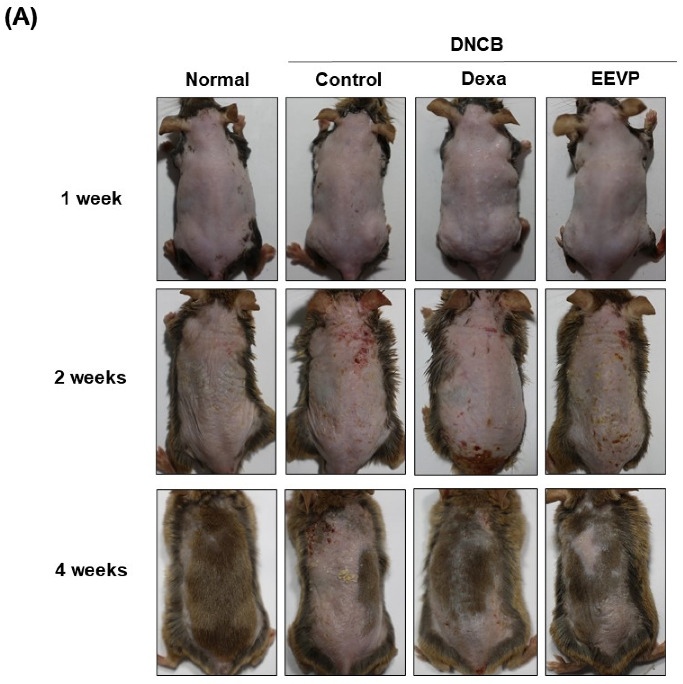
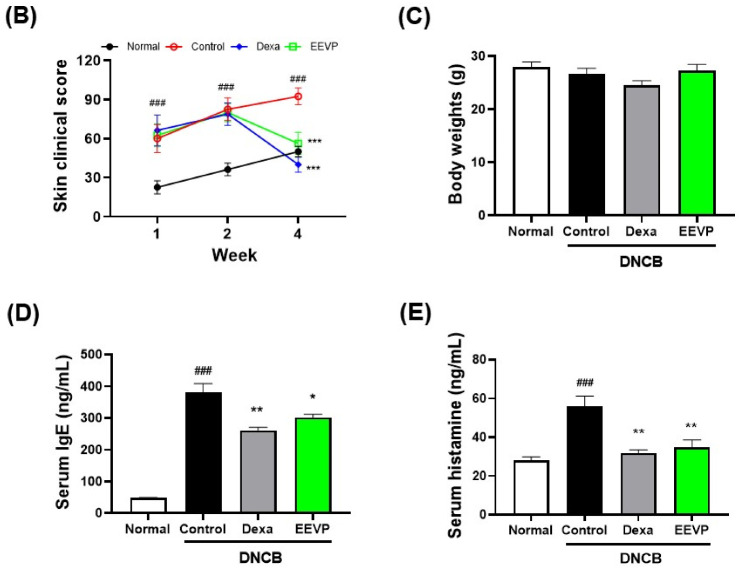
Effects of EEVP on the development of DNCB-induced AD in NC/Nga mice. (A) Representative image of dorsal skins of DNCB-challenged mice, (B) skin clinical score, (C) body weight, (D) immunoglobulin E levels, and (E) histamine levels in the sera of each mouse group. Normal: NC/Nga normal control; Control: DNCB-induced AD control group; Dexa: DNCB + 3 mg/kg dexame-thasone; EEVP 200: DNCB + 200 mg/kg of EEVP. Values are expressed as mean ± standard error of the mean (n = 6). ### p < 0.001 vs. Normal; * p < 0.05, ** p < 0.01, and *** p < 0.001 vs. Control as determined using one-way analysis of variance followed by multiple comparison tests.

