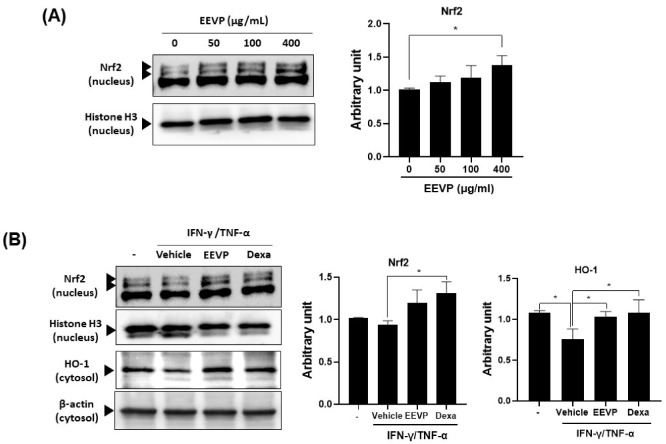
Figure 7.
Stimulatory effects of EEVP on Nrf2 and HO-1 expression in HaCaT cells. (A) Nrf2 expression in the nucleus was examined in HaCaT cells after EEVP (0, 50, 100, and 400 μg/mL) treatments. (B) Nrf2 and HO-1 expression in the nucleus and cytosol, respectively, were examined in HaCaT cells after EEVP (400 μg/mL) treatment. Vehicle: DMSO-treated cells; Dexa: dexamethasone (20 μM)-treated cells; EEVP: EEVP-treated cells. Quantified Western blot data are shown as the mean ± standard deviation (n = 3). * p < 0.05 as determined using two-tailed t-tests.

