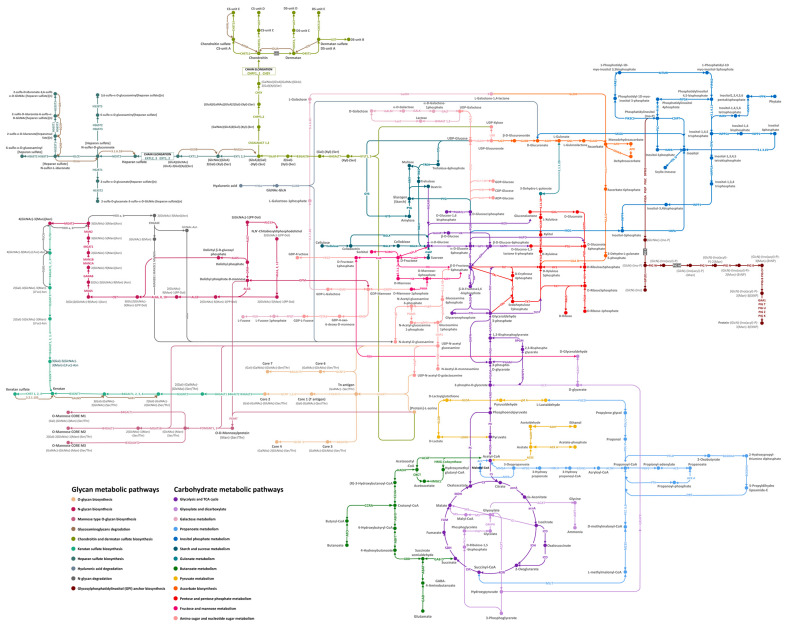
Figure 2.
Overview of the carbohydrate and glycan metabolic pathways of the Achatina fulica snail reconstructed by the genomic contig data and functionally annotated based on the KEGG pathway database followed by three-step manual curation to fill the additional enzymes into the missing gaps. The interaction graph indicates the enzymes with solid dots, the enzymatic direction with arrows, pathway annotation with different colours, intermediates or metabolites with black characters, and enzyme names with coloured abbreviated names. Text labels show the pathway names.

