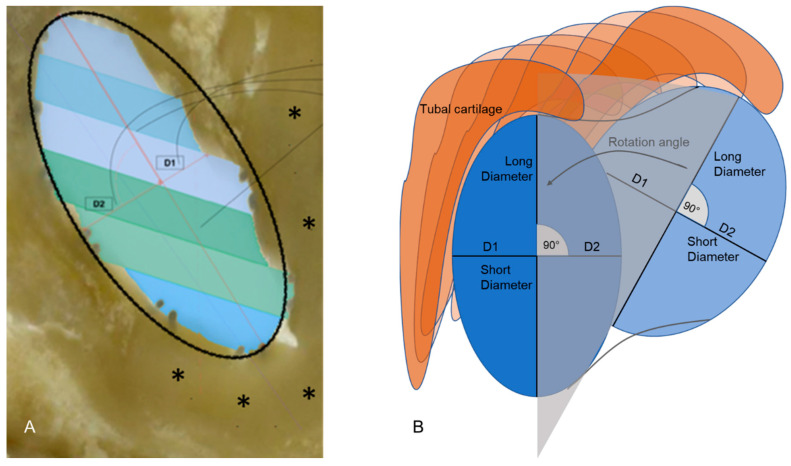
Figure 2.
(A) Representation of the approximated ellipse, the long and short diameter, and the division of the short diameter into D1 and D2. The tubal cartilage is marked by asterisks. The different colors in the lumen of the ET indicate the different histologic sections contributing to this virtual slice through the 3D model. (B) Schematic presentation of a section through stent and ET perpendicular to the axis of the stent. Different measured diameters and lengths, and a rotation of the long axis following the stent in the ET are indicated.

