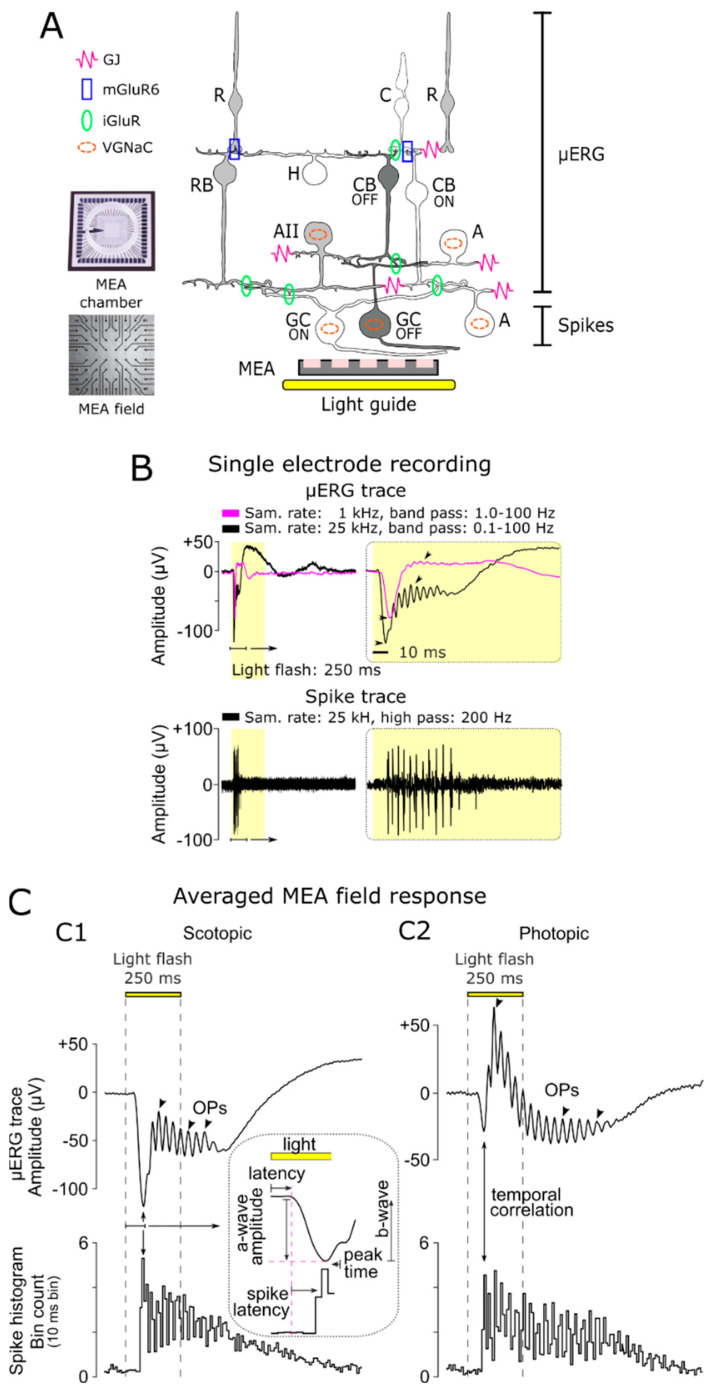
Figure 1.
Multi-layered recordings of light-evoked responses in the retina. (A) Experimental setup: Retinal explants are placed in the multi-electrode array (MEA) chamber with ganglion cells (GCs) contacting the electrode field (59 electrodes—electrode diameter: 30 µm; spacing: 200 µm). Light flashes of different intensities were applied through the transparent MEA via a light guide and collimator (250 ms full-field flash). Sketch of retinal circuitry showing functional pathways that govern the micro-electroretinogram (µERG) response: rod (R) and cone (C) photoreceptor, horizontal cell (H), rod bipolar cell (RB), ON- and OFF-type cone bipolar cells (CB), amacrine cell (AII) relaying the rod system (grey) on to the cone system (white), representative diverse amacrine cells (A) modulating retinal functions, and ON (white)- and OFF (dark)-type ganglion cells (GC). µERG relevant functional connections: gap junctions (GJ), metabotropic glutamate receptors (mGluR6), inotropic glutamate receptors (iGluR), and cells with voltage-gated sodium channels (VGNaC). (B) Differentiation of multi-layer retinal field potentials (representative single-electrode recording): µERG, signal of rod and cone photoreceptors, BCs (magenta: sample rate 1 kHz, band-pass filtered 1–100 Hz; black: sample rate 25 kHz, band-pass filtered: 0.01–100 Hz), and GC spike responses (sample rate: 25 kHz; high-pass filter: 200 Hz). The high sampled data revealed larger amplitude and signal details (arrowhead). (C) Representative averaged MEA field responses under (C1) scotopic (12 h dark-adapted; flash intensity: 4.20 × 10¹³ photons/cm2/s) and (C2) photopic (5 min light-adapted at background light intensity of 4.20 × 10¹³ photons/cm2/s; flash intensity: 4.20 × 10¹⁵ photons/cm2/s) conditions: µERG traces (upper panel), oscillatory potentials (OPs, arrowhead), and corresponding spike responses (spike histogram, 10 ms bin spike count; lower panel). The inset shows a magnified µERG trace and illustrates the latencies between a-wave, b-wave, and GC spiking activity.

