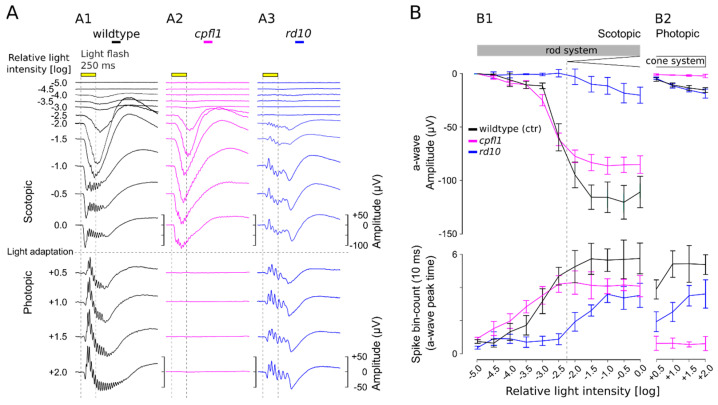
Figure 2.
µERG recordings on rod and cone mutant mouse models. (A) Representative µERG recordings of (A1) wild-type mice, (A2) the cone photoreceptor function loss-1 (cpfl1), and (A3) the retinal degeneration-10 (rd10) mouse models. The µERG protocol included eleven 0.5 log unit steps with increasing light intensities (upper panel; from 1.33 × 10⁹ to 4.20 × 10¹³ photons/cm2/s) and four photopic stimuli in 0.5 log steps (lower panel; from 1.33 × 10¹⁴ to 4.20 × 10¹⁵ photons/cm2/s). The light intensity is presented in log units relative to the light intensity required for photopic adaptation (5 min; 4.20 × 10¹³ photons/cm2/s) and also serves as the background light. (B) Evaluation of correlated photoreceptor and ganglion cell light responses. Analysis of photoreceptor a-wave responses (µV; upper panel) and ganglion cell spike counts (10 ms bin; lower panel) in retinal µERG recordings for wild-type, cpfl1, and rd10 retinas (n = 5). (B1) Scotopic conditions illustrating rod system activity. (B2) Photopic conditions for cone system activity. At −2.0 log units, the boundary between rod-only and mixed rod–cone responses is indicated (dashed line). Error bars indicate mean ± SEM.

