Figure 3.
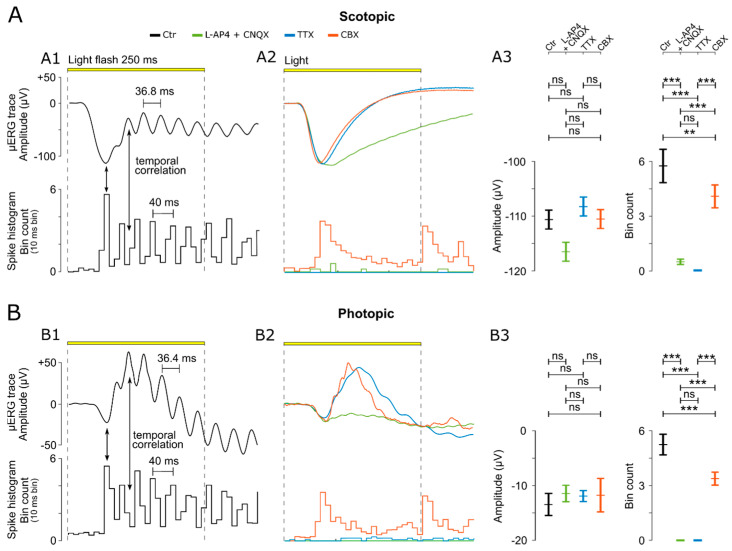
Analysis and experimental manipulation of µERG oscillatory potentials. (A) Analysis of µERG data under scotopic conditions. (A1) µERG and ganglion cell (GC) responses obtained from untreated (Ctr) wild-type retinal explants. Arrows indicate characteristic temporal correlations between the a-wave peak and GC spike response peak (cf. Figure 1, inset), as well as between the b-wave oscillatory potentials (OPs) and GC spiking activity. (A2) Representative µERG and GC responses recorded in the presence of either a combination of ionotropic glutamate receptor blocker CNQX and metabotropic glutamate receptor agonist L-AP4, the voltage-gated sodium channel blocker TTX, or the gap-junction blocker (CBX). (A3) Evaluation of µERG a-wave amplitude (µV) (left panel) and ganglion cell (GC) spike responses (counts per 10 ms bin) (right panel) under control and in the presence of respective blockers. (B) Analysis of µERG under photopic conditions (as in (A)). For each treatment condition, a separate wild-type retina was used (n = 5 retinas/recording; each recording averaged from 59 electrodes). Statistical significance was estimated by one-way analysis of variance (ANOVA), followed by Dunnett’s multiple comparisons test (***: p < 0.001; **: p < 0.1; and ns: not significant). Error bars indicate mean ± SEM.

