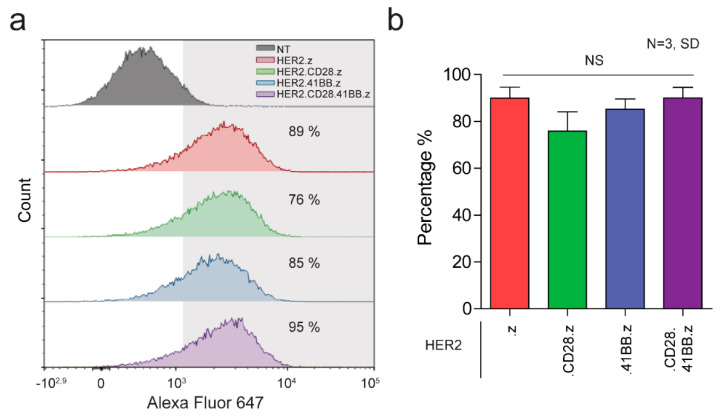
Figure 1.
Generation of CAR T cell products from first to third generation. (a) Representative flow cytometry histogram of non-transduced (NT) T cells, and HER2.z, HER2.CD28.z, HER2.41BB.z and HER2.CD28.41BB.z CAR T cells. (b) Expression of the HER2-CARwas quantified with indirect labeling using a HER2-Fc fusion protein and an Alexa Fluor 647-conjugated anti-human IgG (N = 3). Histograms represent mean ± SD.

