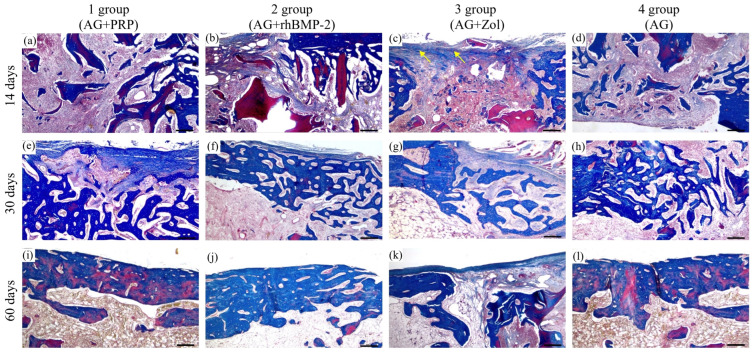
Figure 6.
Micrographs of stage-specific closure of the bone plate defect in the control and experimental groups at 14, 30, and 60 days after implantation. (a,e,i) AG + PRP group: active osteogenesis with formation of bands of newly formed bone tissue on the 14th day and complete closure of the defect by mature bone tissue on the 30–60th day (Masson’s trichrome × 40. Scale bar, 500 µm). (b,f,j) AG + rhBMP-2 group: active osteogenesis with uneven closure of the defect thickness by mature bone tissue on day 30–60 (Masson’s trichrome × 40. Scale bar, 500 µm). (c,g,k) AG + Zol group: heterogeneity of the osteogenesis pattern (weak to moderate) with weak allograft remodeling on day 14 and partial closure of the bone plate defect by the newly formed bone tissue and fibrous tissue (yellow arrow) on day 30–60 (Masson’s trichrome × 40. Scale bar, 500 µm). (d,h,l) AG group: moderate osteogenesis with the formation of bands of newly formed bone tissue on the 14th day and complete closure of the defect with mature bone tissue on the 60th day (Masson’s trichrome × 40. Scale bar, 500 µm).

