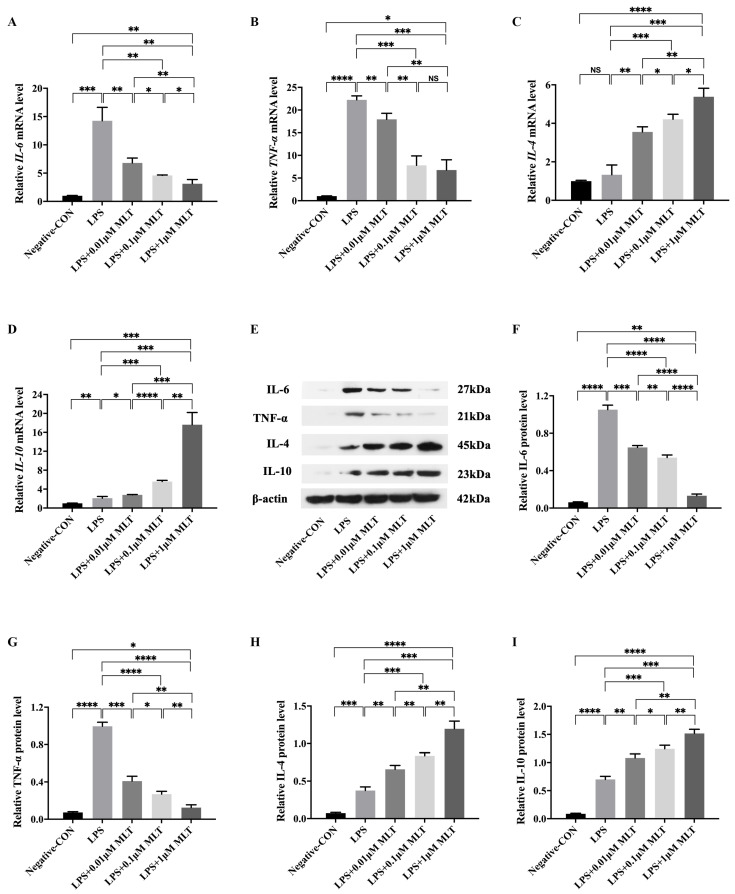
Figure 2.
Downregulated M1-type Mφ markers and upregulated M2-type Mφ markers of Mφs by the treatment of MLT. RAW 264.7 Mφs were treated with LPS 6 h and followed by the presence or absence of MLT for 24 h, then followed by RT-qPCR and Western blot. (A–D) The relative mRNA levels of M1-type Mφ genes (IL-6 and TNF-α) and M2-type Mφ genes (IL-4 and IL-10) were measured by RT-qPCR analyses (n = 3). (A) The levels of IL-6 mRNA were reduced in the presence of MLT treatment at different dosages. (B) The levels of TNF-α mRNA were decreased in the presence of MLT treatment at different dosages. (C) The levels of IL-4 mRNA were increased in the presence of MLT treatment at different dosages. (D) The levels of IL-10 mRNA were enhanced in the presence of MLT treatment at different dosages. (E–I) The relative protein levels of Mφ markers in Mφs were measured by Western blot analyses (n = 3). (E) Western blotting showed the downregulation of M1-type Mφ markers and upregulation of M2-type Mφ markers. (F) Quantitative analysis showed the reduced levels of IL-6 protein after the treatment with MLT at different dosages. (G) Quantitative analysis showed the reduced levels of TNF-α protein after the treatment with MLT at different dosages. (H) Quantitative analysis showed the enhanced levels of IL-4 protein after the treatment with MLT at different dosages. (I) Quantitative analysis showed the increased levels of IL-10 protein after the treatment with MLT at different dosages. Data are expressed as mean ± standard deviation. The two groups among the five groups are compared by using an independent t-test. * p < 0.05, ** p < 0.01, *** p < 0.001, **** p < 0.0001.

