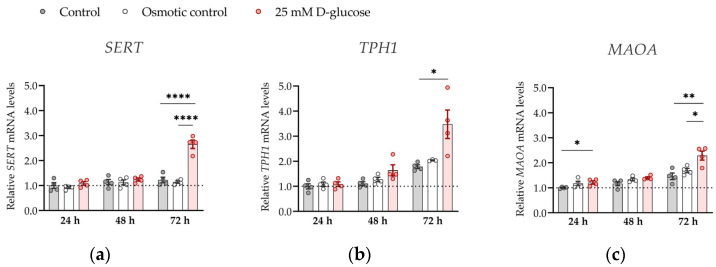
Figure 4.
Effect of glucose on mRNA expression of serotonin-regulating genes in conditions of 21% O2. ACH-3P cells were cultured in the presence of 5.5 mM D-glucose (control, gray bars), 5.5 mM D-glucose + 19.5 mM L-glucose (osmotic control, white bars) or 25 mM D-glucose (hyperglycemia, red bars) for 24 h, 48 or 72 h at ambient oxygen. Relative expression levels of (a) SERT, (b) TPH1 and (c) MAOA mRNA were determined by RT-qPCR and normalized to YWHAZ mRNA level. Results of two independent experiments, each done in duplicate, are shown. For each gene, data are presented relative to the mean of the control samples after 24 h, which was arbitrarily set to 1.00: bars represent mean ± SEM. Statistical analysis used ANCOVA with cell passage as covariate and Sidak’s post hoc test to adjust for multiple comparisons. * p < 0.05, ** p < 0.01 **** p < 0.0001.

