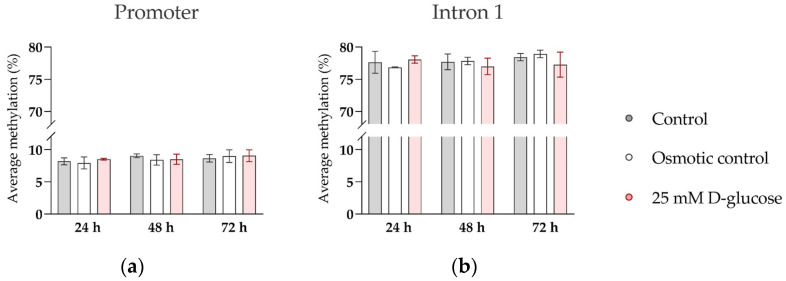
Figure 5.
Effect of glucose on DNA methylation of SERT promoter and intron 1 region in ACH-3P cells. Cells were cultured in the presence of 5.5 mM D-glucose (control, gray bars), 5.5 mM D-glucose + 19.5 mM L-glucose (osmotic control, white bars), or 25 mM D-glucose (hyperglycemia, red bars) for 24 h, 48 h, or 72 h, at ambient oxygen level. Average DNA methylation across (a) 9 CpG sites in the promoter region and (b) 14 CpG sites in the intron 1 region, determined by bisulfite pyrosequencing, is shown (Mean ± SEM; n = 3–4).

