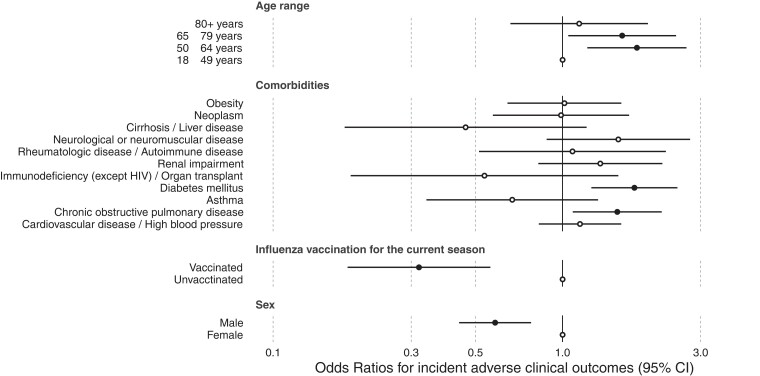
Figure 2.
Forest plot illustrating the odds ratios (circles) and associated 95% confidence intervals ([CI] horizontal bars) from the logistic model for the composite severe outcome of death or intensive care unit admission of laboratory-confirmed influenza cases in the 2018/2019 season. Hollow circles indicate where the confidence interval crosses the null, representing the point estimates for which the covariables have no significant effect. HIV, human immunodeficiency virus.

