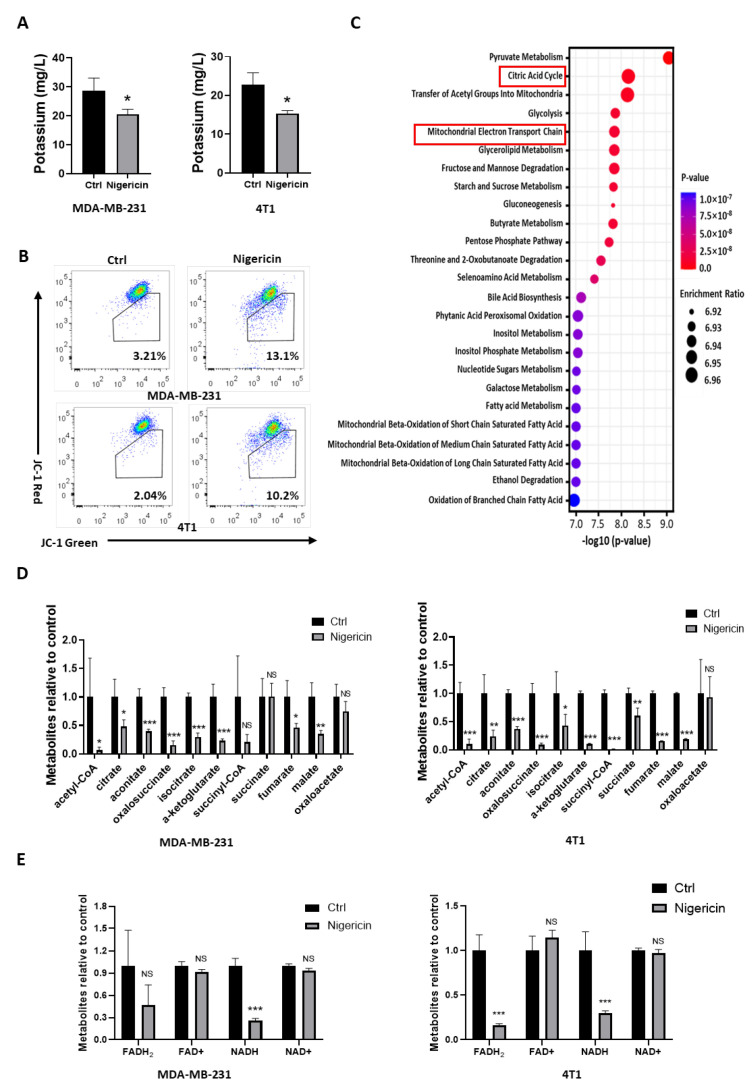
Figure 3.
Nigericin treatment leads to mitochondrial dysfunction. (A) Changes in intracellular potassium level in TNBC cells before and after nigericin treatment (2 μg/mL for 6 h), as detected via ICP-MS. Bar graphs stand for mean ± SD of experimental triplicates (t-test, * p < 0.05). (B) Mitochondrial membrane potential changes in TNBC cells (nigericin 2 μg/mL for 6 h), as detected via JC-1 probes. At high mitochondrial membrane potential, JC-1 aggregated and yielded red-colored emission (590 nm). At low mitochondrial membrane potential, JC-1 was predominantly a monomer that yielded green-colored emission (530 nm). (C) Metabolites screened via mass spectrometry in 4T1 cells with or without nigericin treatment. Metabolic pathway enrichment of differential metabolites was performed based on Metaboanalyst (https://www.metaboanalyst.ca (accessed on 31 October 2020)). (D,E) Nigericin significantly impacted mitochondrial metabolism. (D) Metabolites of TCA cycle and (E) oxidative phosphorylation upon nigericin treatment detected via mass spectrometry. Bar graphs stand for mean ± SD of experimental quadruplicates (t-test, * p < 0.05, ** p < 0.01, *** p < 0.001). TNBC, triple-negative breast cancer; JC-1, tetraethylbenzimidazolylcarbocyanine iodide; ICP-MS, inductively coupled plasma mass spectrometry; TCA cycle, tricarboxylic acid cycle; FADH2, flavin adenine dinucleotide; NADH, nicotinamide adenine dinucleotide.

