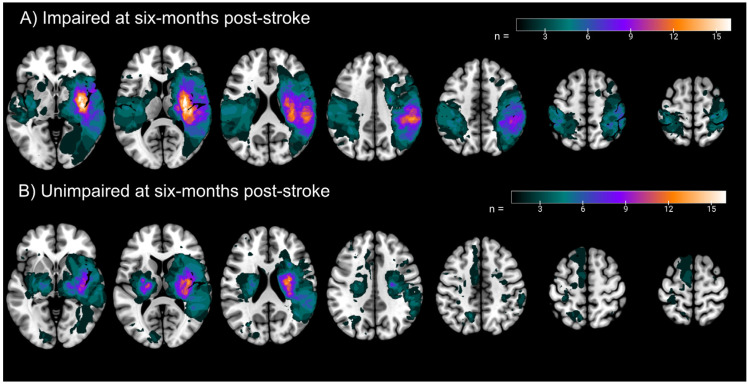
Figure 2.
Lesion Overlaps—Lesion overlaps for (A) Participants impaired on the APM Task at six months post-stroke, and (B) Participants unimpaired on the APM Task at six months post-stroke. All lesions are normalised to Montreal Neurological Institute space and are presented in neurological convention (right hemisphere presented on the right). Color bar indicates the number of participants with lesions at each voxel. Axial slices (from left to right), z = −2, 10, 22, 34, 46, 58, 64.

