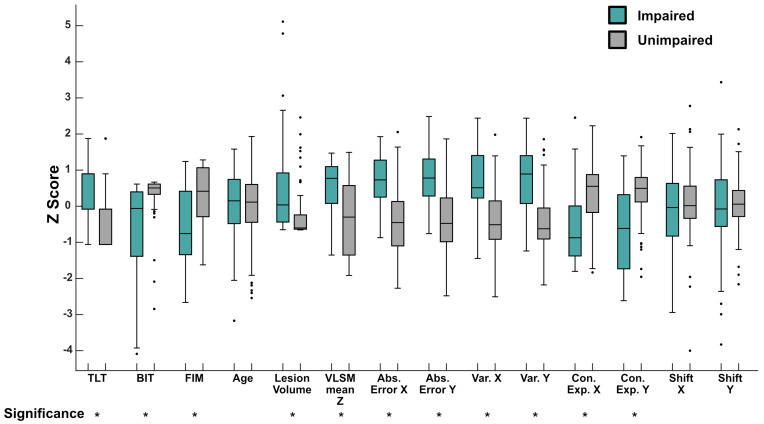
Figure 3.
Group Level Differences in Clinical, Neuroimaging and Robotic Featuress Between Those Impaired and Unimpaired on the Arm Position Matching Task—Boxplots presenting features collected at two weeks post-stroke, for those impaired on the APM task (green) and those unimpaired (grey) at six months post-stroke. Given the varied scales each feature is scored on, scores are presented as z-scores for illustrative purposes. Boxes represent the median (centre line), 25th percentile (bottom line) and 75th percentile (top line), respectively. Whiskers extend to the highest and lowest data points, within 1.5 times the interquartile range from the top or bottom of the box. Individual data points displayed outside of this range signify outliers. Mann–Whitney U tests were conducted on the raw scores for each measure, between groups. * below each label indicates that feature had a significant difference between the impaired and unimpaired groups (p < 0.0005). Abs. Error = Absolute Error, Var = Variability, Con. Exp = Contraction Expansion.

