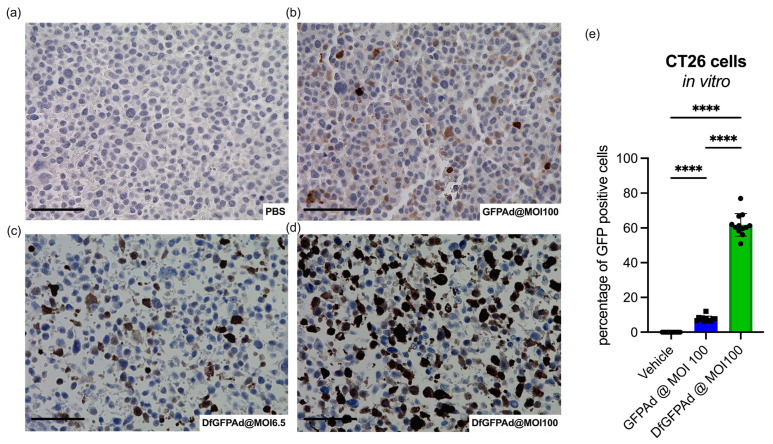
Figure 2.
Transduction of CT26 and cell viability with unencapsulated virus. IHC slides show anti-GFP staining of GFPAd transduced CT26 cells. A comparison between the control PBS (a), unencapsulated GFPAd at MOI 100 (b), liposome-encapsulated GFPAd-Df at MOI 6.5 (c), and GFPAd-Df at MOI 100 (d), transduced CT26 cells. Quantification of stained GFP-positive cells based on the IHC slides (e). Mean GFP positive cells based on IHC images of n = 12 and standard deviations are shown. scale bar = 50 μm, **** p < 0.0001.

