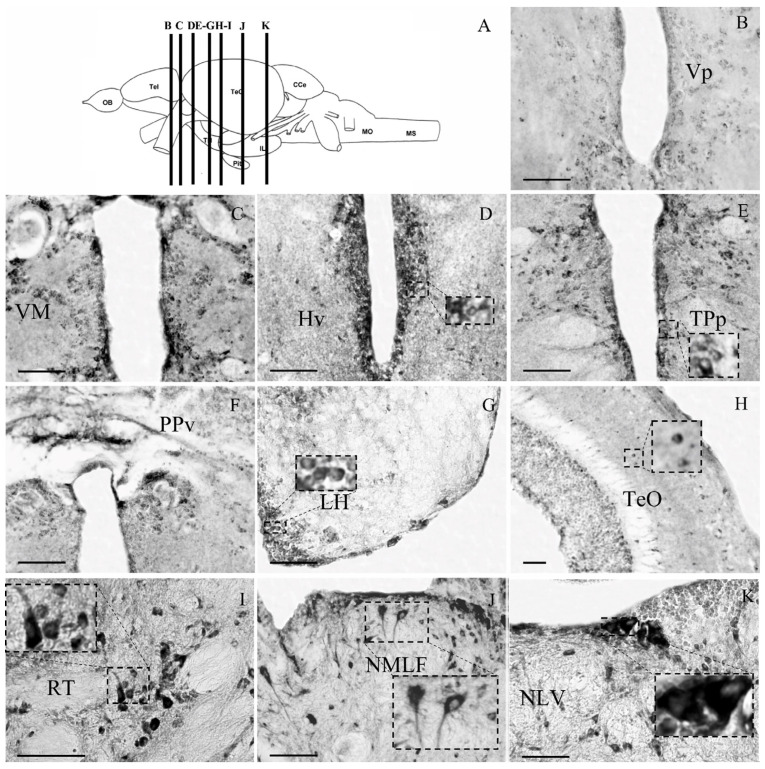
Figure 3.
Microphotographs of GRα-ir in zebrafish posterior forebrain and midbrain levels, shown in (A), from the atlas of Wullimann (1996) [47]. (B) Post-commissural nucleus of ventral telencephalic area, Vp; (C) ventromedial thalamic nucleus, VM; (D) ventral zone of periventricular hypothalamus, Hv; (E) periventricular nucleus of posterior tuberculum, TPp; (F) ventral part of periventricular pretectal nucleus, PPv; (G) lateral hypothalamic nucleus, LH; (H) optic tectum, TeO; (I), midbrain nucleus, RT; (J) the nucleus of medial longitudinal fascicle, NMLF; and (K) nucleus lateralis valvulae, NLV. Lateral is on the right for (G–K). Insert frames of higher magnification show examples of cytoplasmic labeling. Scale bar = 0.05 mm.

