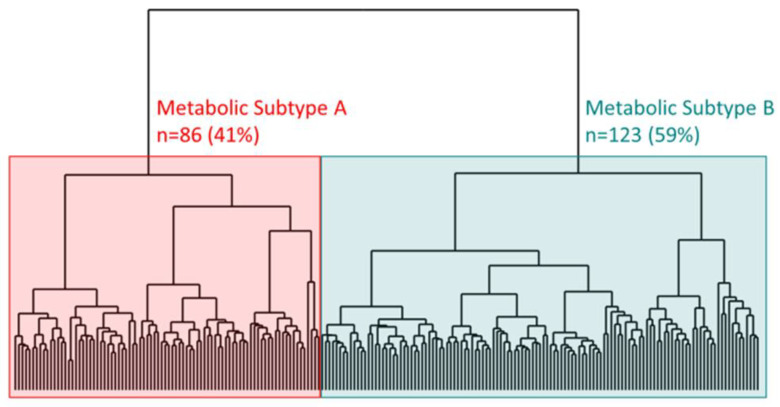
Figure 1.
Dendrogram showing two metabolic subtypes, A (red) and B (teal), identified from an unsupervised hierarchical clustering analysis of 209 head and neck cancer patients using 186 lab-confirmed plasma metabolites. Subtype A, the high-risk type showing relatively higher amounts of fatty acid, acetyl Co-A, and amino acid biosynthesis as well as glycolytic metabolism, represents 41% of the sample population and subtype B, the remaining 59%.

