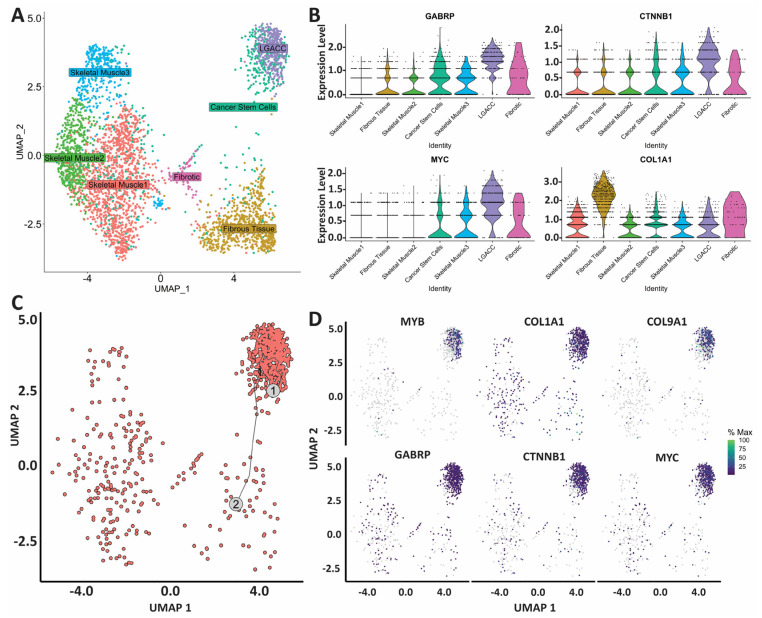
Figure 4.
Characterization of cluster 3 as potential transition or cancer stem cell cluster. (A) UMAP of cell cluster identities. (B) Violin plots of gene signature of cluster 3 alone and when compared with muscle cell clusters. (C) Monocle trajectory map indicating a zoomed-in UMAP of cluster 5 (LGACC) (indicated as 1 on the graph) as the primary and cluster 3 (indicated as 2 on the graph) cells coming from the malignant cluster. (D) UMAPs of genes of interest for cluster 3 found in trajectory analysis.

