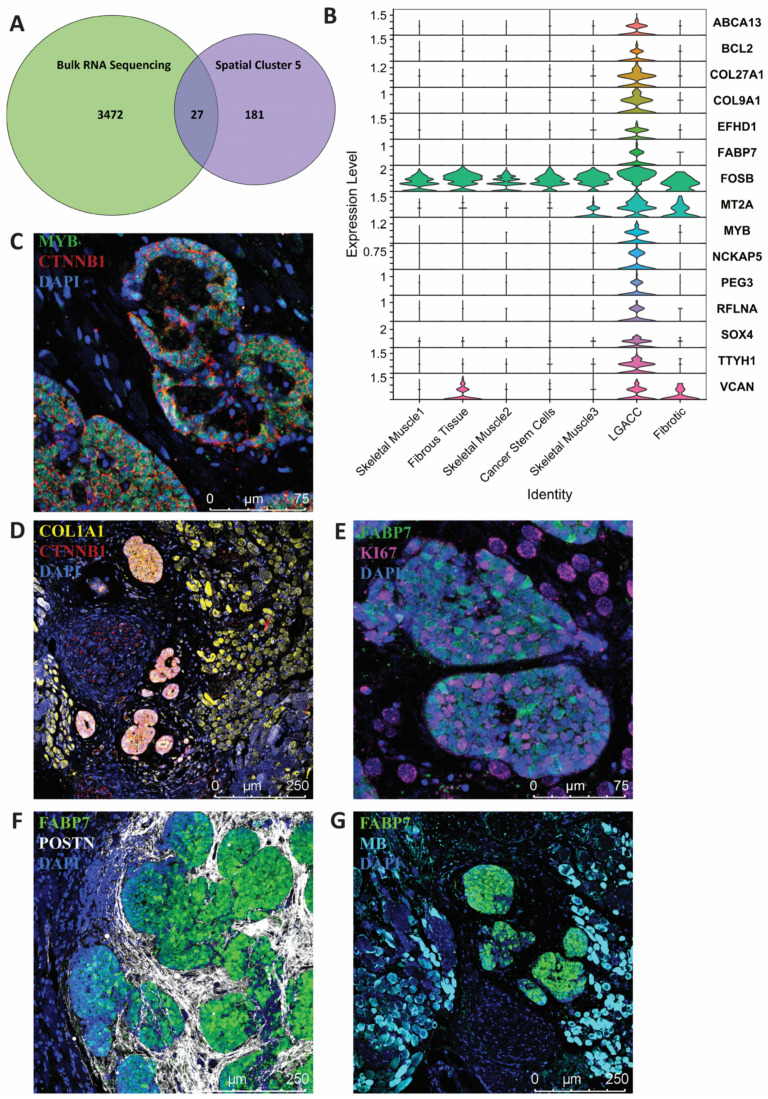
Figure 5.
LGACC-specific signature identified through spatial transcriptomics and bulk RNA sequencing. (A) Venn diagram representing differentially expressed genes from bulk RNA sequencing and spatial transcriptomics and the overlap found between the two. (B) Stacked violin plot of 15 overexpressed genes that are found in both bulk and spatial transcriptomics. (C–G) Immunofluorescent staining of LGACC-specific signature and surrounding tissue signatures.

