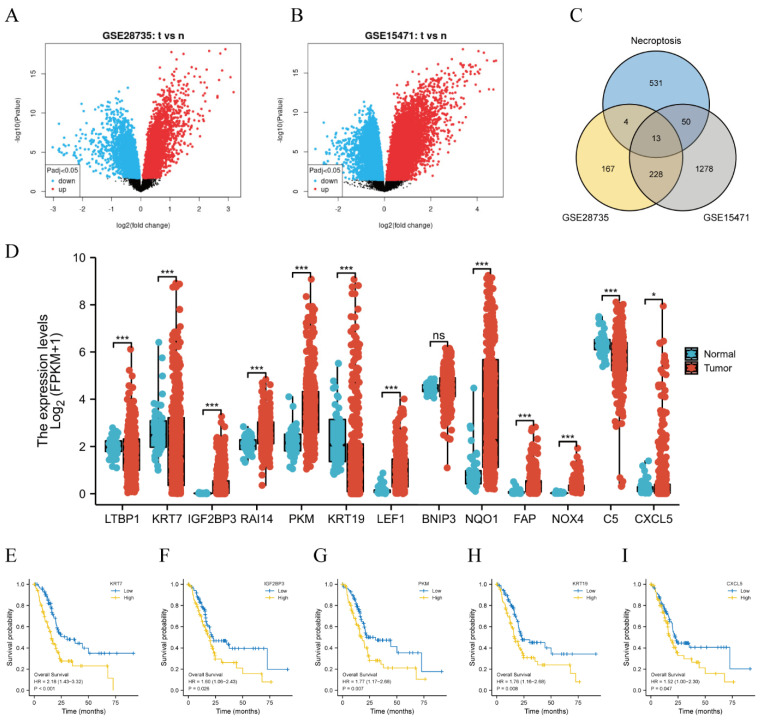
Figure 2.
Five NRDEGs were identified based on GEO and TCGA database. (A) Volcano plot of differentially expressed genes from GSE28735. (B) Volcano plot of differentially expressed genes from GSE15471. (C) Venn diagram of the intersection of DEGs and necroptosis-related genes. (D) Differential expression of 13 NRDEGs in the TCGA database. * means p < 0.05, *** means p < 0.001 and ns means no sense. (E–I) Kaplan–Meier curves of NRDEGs: (E) KRT7 (p < 0.001), (F) IGF2BP3 (p = 0.026), (G) PKM (p = 0.007), (H) KRT19 (p = 0.008), (I) CXCL5 (p = 0.047).

