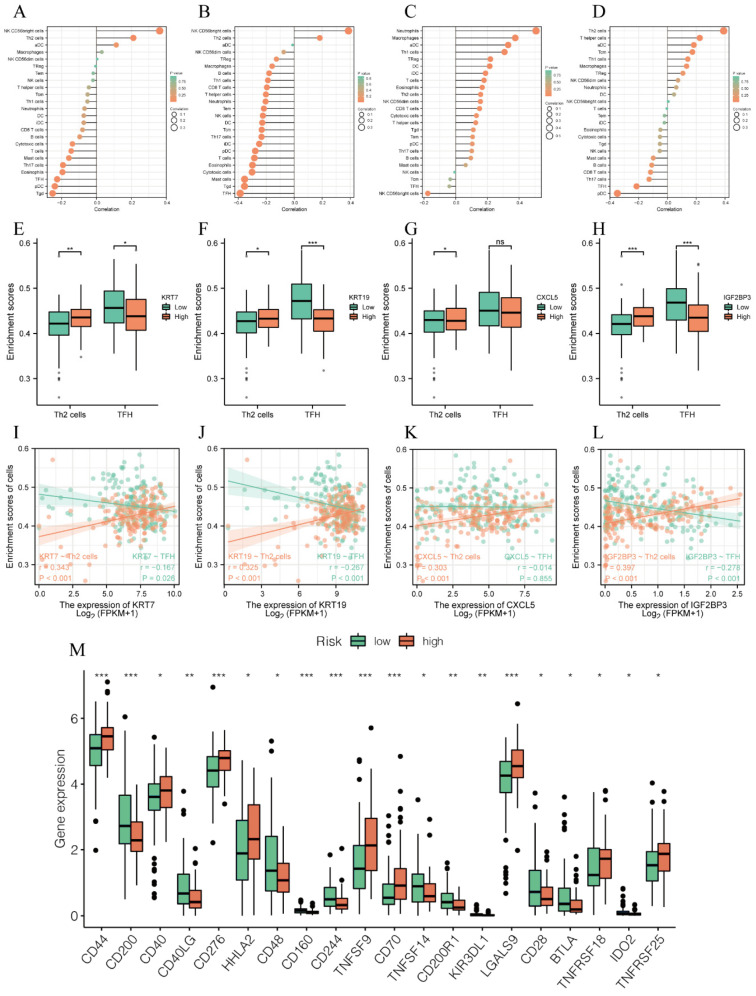
Figure 6.
Model genes regulated immunity of PC. (A–D) The correlation of model genes with various immune cells: (A) KRT7, (B) KRT19, (C) CXCL5, (D) IGF2BP3. (E–H) Histogram of correlation between model genes and immune cells (Th2, TFH cells). (I–L) Scatter plot of correlation between model genes and immune cells (Th2, TFH cells). (M) Expressions of immune checkpoints between the high- and low-risk groups. * means p < 0.05, ** means p < 0.01, *** means p < 0.001 and ns means no sense.

