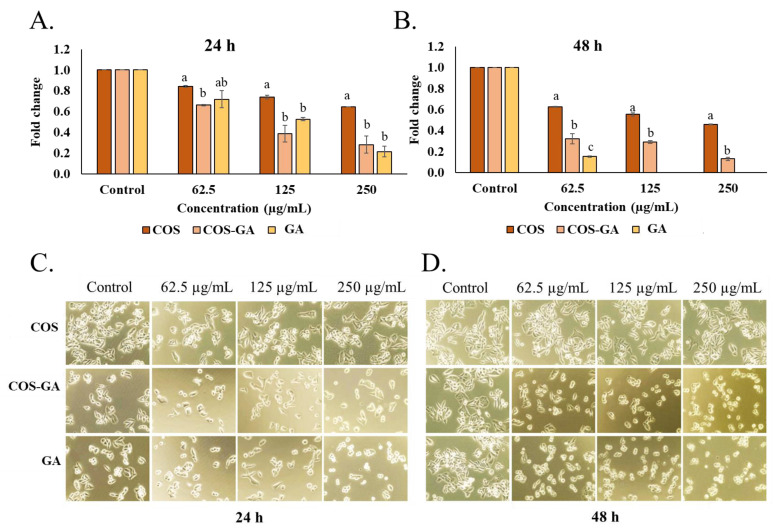
Figure 1.
Cell viability after treatment with COS and COS–GA. MTT assay of SW620 cells after COS, GA, and COS–GA treatment at different concentrations for 24 h (A) and 48 h (B). SW620 cell morphology after COS, GA, and COS–GA treatment for 24 h (C) and 48 h (D). Data are shown as means ± standard deviations from triplicate experiments. Different lowercase letters on the bars within the same concentration denote statistically significant differences (p < 0.05).

