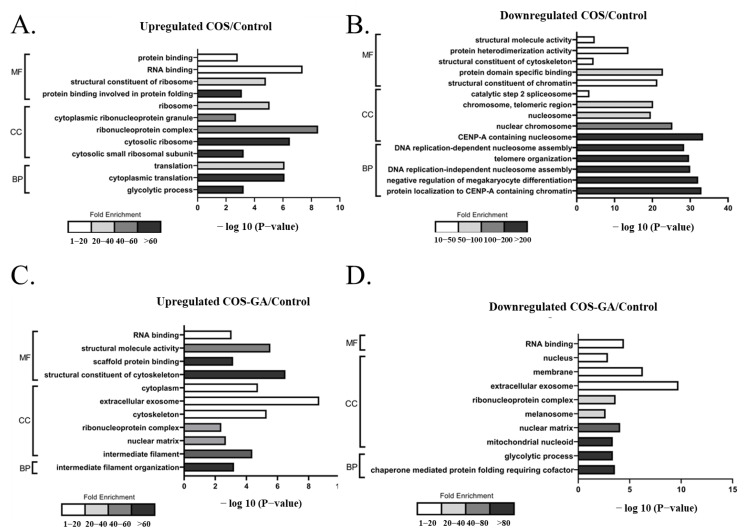
Figure 4.
Analysis of the functional pathways of the differentially expressed proteins in COS- and COS–GA-treated SW620 cells. Pathways upregulated (A) and downregulated (B) in the COS treatment group compared to the control group. Pathways upregulated (C) and downregulated (D) in the COS–GA treatment group compared to the control group.

