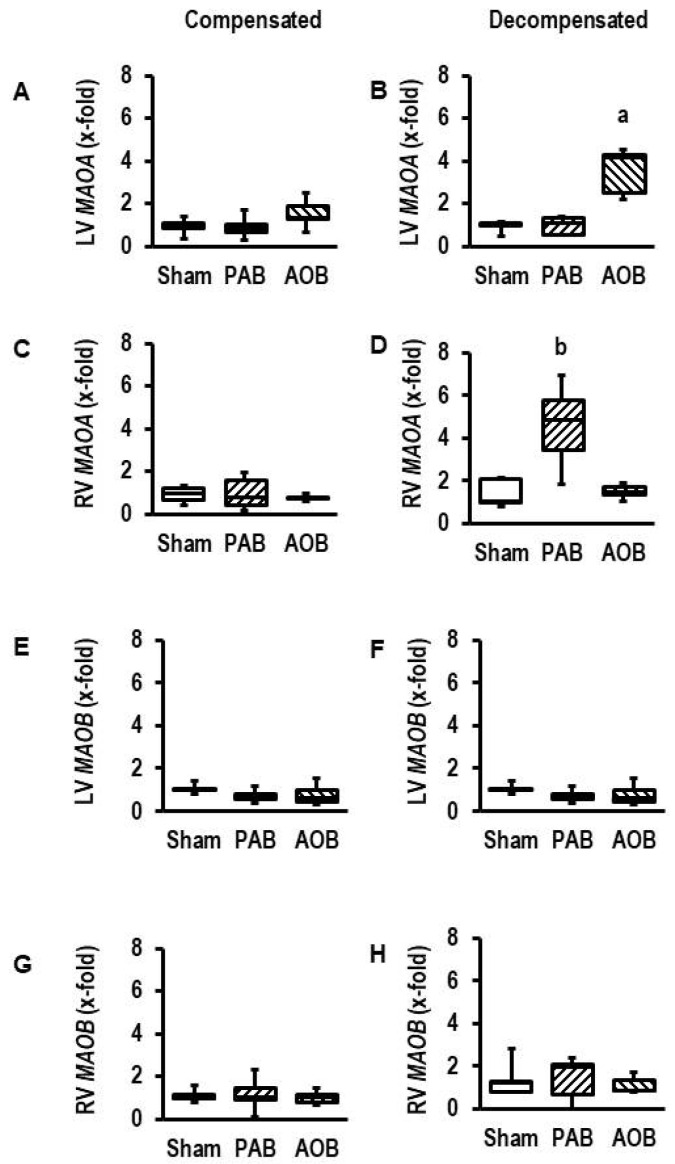
Figure 1.
Expression of MAO isoforms in rat hearts exposed to pressure overload by aortic banding (AOB) and pulmonary artery banding (PAB). (A) Expression of MAOA in the left ventricle in hearts from AOB and PAB rats with still normal cardiac function (compensated state). (B) Expression of MAOA in the left ventricle in hearts from AOB and PAB rats with reduced cardiac function (decompensated state). (C) Expression of MAOA in the right ventricle in hearts from AOB and PAB rats with still normal cardiac function (compensated state). (D) Expression of MAOA in the right ventricle in hearts from AOB and PAB rats with reduced cardiac function (decompensated state). (E) Expression of MAOB in the left ventricle in hearts from AOB and PAB rats with still normal cardiac function (compensated state). (F) Expression of MAOB in the left ventricle in hearts from AOB and PAB rats with reduced cardiac function (decompensated state). (G) Expression of MAOB in the right ventricle in hearts from AOB and PAB rats with still normal cardiac function (compensated state). (H) Expression of MAOB in the right ventricle in hearts from AOB and PAB rats with reduced cardiac function (decompensated state). Data are full ranges (whiskers) with median and 25 and 75% quartiles (boxes) (n = 5 hearts each). a, p = 0.000077 in two-sided ANOVA with AOB > Sham and PAB in Student–Newman–Keuls post hoc analysis; b, p = 0.002 in two-sided ANOVA with PAB > Sham and AOB in Student–Newman–Keuls post hoc analysis; p > 0.05 (two-sided ANOVA) for all (A–H).

