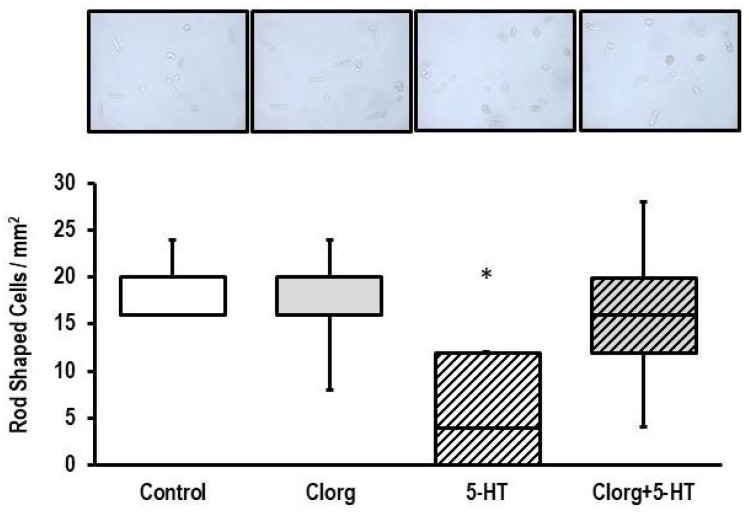
Figure 5.
Effect of 5-HT on cell structure. (Top) Original photographs obtained from cultures exposed to clorgyline (1 µM), 5-HT (100 µM), or combinations thereof for 24 h (n = 5 each). For greater visibility of rod-shaped and round cells, see Supplementary Information. Data are expressed as the number of rod-shaped cells per mm2. Data are full ranges (whiskers) with median and 25 and 75% quartiles (boxes). *; p < 0.05 vs. control; Kruskal–Wallis test with Bonferroni (correction for multiple testing) post hoc analysis.

