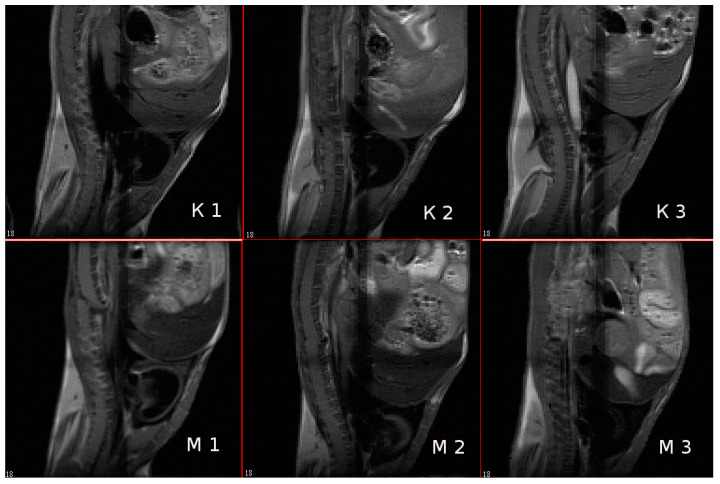
Figure 13.
Mouse liver tomograms in sagittal sections (projections). Pulse sequence MSME. TE = 8 ms; (K1–K3)—control mice, (M1–M3)—mice 60 min after intravenous injection of 0.1 mL of SPIONs@IFNα-2b conjugate solution (at Fe concentration of 0.01 mg/mL). The numbers in the figures are the numbers of consecutive sections.

