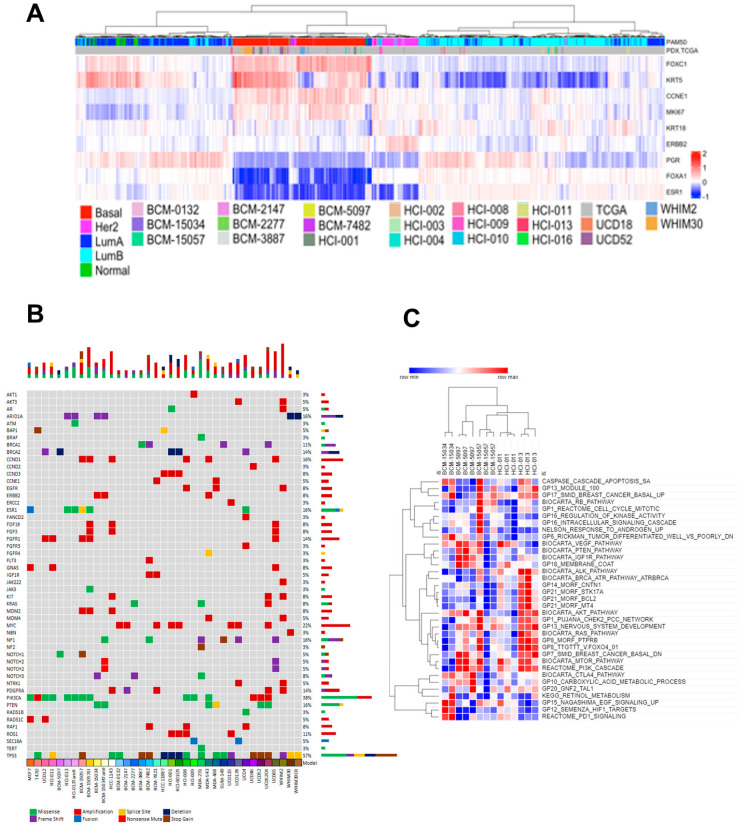
Figure 2.
Transcriptomic and genomic profiling of a bank of PDX models. (A) RNA sequencing data from ER+, HER2 amplified, and triple-negative PDX tumors were combined with TCGA transcriptomic data. PAM50 subtyping of PDX samples was performed, and a subset of the PAM50 gene set was used in hierarchical clustering of the combined dataset. (B) Oncoplot depicting mutated genes, amplifications, and RNA fusions in cell line and PDX models of ER+, HER2 amplified, and triple-negative breast cancer. (C) Gene signature score calculation was performed, and a selection of GSEA gene signatures was used in hierarchical clustering of ER+ PDX models.

