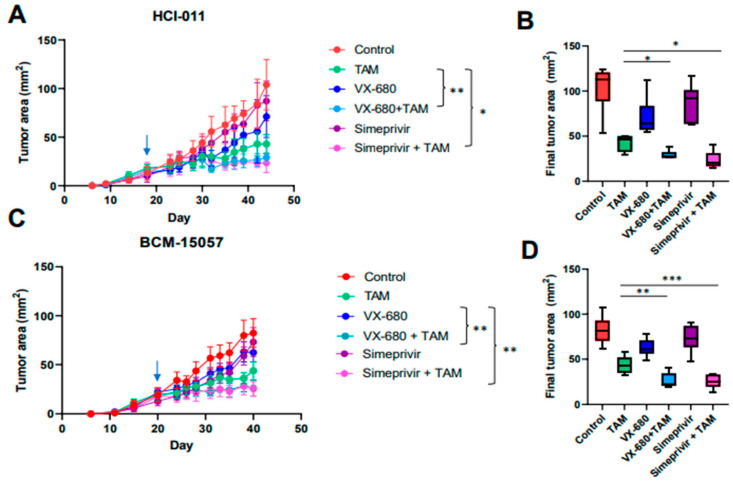
Figure 7.
In vivo testing of selection tamoxifen combination therapy. (A,C) In vivo growth curve of orthotopic mammary tumors and final tumor area of HCI-011 (A) and BCM-15057 (C). Arrows denote the start of treatment. Two-way ANOVA with Tukey’s multiple comparison was performed where * p < 0.05 and ** p = 0.005. (B,D) Box and whisker plots of final tumor area of each group in HCI-011 (B) and BCM-15057 (D). An unpaired t-test was performed to compare the tamoxifen-treated group with VX-680 + TAM and simeprevir + TAM individually. * p < 0.05, ** p < 0.005, *** p < 0.001.

